


Suppose the hypothetical country of Roadway is completely isolated from the rest of the world. It neither exports nor imports goods and services. We shall use the production possibilities model to analyze Roadway’s ability to produce goods and services.
A production possibilities curve illustrates the production choices available to an economy. Recall that the production possibilities curve for a particular country is determined by the factors of production and the technology available to it.
Figure 17.1 shows a production possibilities curve for Roadway. We assume that it produces only two goods—trucks and boats. Roadway must be operating somewhere on its production possibilities curve or it will be wasting resources or engaging in inefficient production. If it were operating inside the curve at a point such as D, then a combination on the curve, such as B, would provide more of both goods (Roadway produces 3,000 more trucks and 3,000 more boats per year at B than at D). At any point inside the curve, Roadway’s production would not be efficient. Point E suggests an even higher level of output than points A, B, or C, but because point E lies outside Roadway’s production possibilities curve, it cannot be attained.
We have learned that the absolute value of the slope of a production possibilities curve at any point gives the quantity of the good on the vertical axis that must be given up to produce an additional unit of the good on the horizontal axis. It thus gives the opportunity cost of producing another unit of the good on the horizontal axis.
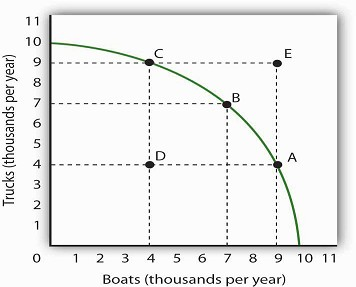
The production possibilities curve for Roadway shows the combinations of trucks and boats that it can produce, given the factors of production and technology available to it. To maximize the value of total production, Roadway must be operating somewhere along this curve. Production at point D implies that Roadway is failing to use its resources fully and efficiently; production at point E is unobtainable.
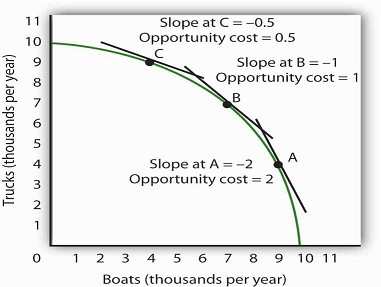
The slope of the production possibilities curve at any point is equal to the slope of a line tangent to the curve at that point. The absolute value of the slope equals the opportunity cost of increased boat production. Moving down and to the right along its production possibilities curve, the opportunity cost of boat production increases; this is an application of the law of increasing opportunity cost.
Figure 17.2 shows the opportunity cost of producing boats at points A, B, and C. Recall that the slope of a curve at any point is equal to the slope of a line drawn tangent to the curve at that point. The slope of a line tangent to the production possibilities curve at point B, for example, is −1. The opportunity cost of producing one more boat is thus one truck. As the law of increasing opportunity costs predicts,in order to produce more boats, Roadway must give up more and more trucks for each additional boat.Roadway’s opportunity cost of producing boats increases as we travel down and to the right on its production possibilities curve.
- 1805 reads
