


The method by which the Census Bureau computes income shares has been challenged by some observers. Robert Rector, of the Heritage Foundation, a conservative think tank, notes three flaws in the Census Bureau approach. First, it ignores taxes. Second, it ignores the $750 billion in spending for the poor and elderly. Third, each quintile does not contain the same nber of people. The top quintile, for example, contains 70% more people than the bottom quintile because households in the lowest quintile tend to have fewer people than those in the highest quintile. Taking the Census Bureau finding that the top quintile receives 50.1% of total income while the bottom quintile receives 3.4% of income implies that people in the top quintile receive $14.74 for every $1.00 received by people in the bottom quintile. But, Mr. Rector points out that once one adjusts for taxes, transfers, and the unequal number of people in each quintile, that 14.74:1 gap falls to $4.21 in the top quintile for every $1.00 in the bottom. By this accounting, incomes in the United States are not nearly as unequal as reported by the Census Bureau. This suggests that more precise measurements may provide more insight into explaining inequality.
KEY TAKEAWAYS
- The distribution of income can be illustrated with a Lorenz curve. If all households had the same income,the Lorenz curve would be a 45° line. In general, the more equal the distribution of income, the closer theLorenz curve will be to the 45° line. A more bowed out curves shows a less equal distribution. The Gini oefficient is another method for describing the distribution of income.
- The distribution of income has, according to the Census Bureau, become somewhat more unequal in the United States during the past 36 years.
- The degree of mobility up and down the distribution of income appears to have declined in recent years.
- Among the factors explaining increased inequality have been changes in family structure and changes in the demand for labor that have rewarded those with college degrees and have penalized unskilled workers.
TRY IT !
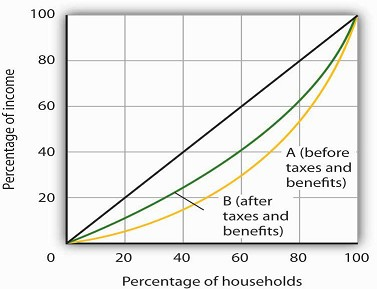
The accompanying Lorenz curves show the distribution of income in a country before taxes and welfare benefits are taken into account (curve A) and after taxes and welfare benefits are taken into account (curve B). Do taxes and benefits serve to make the distribution of income in the country more equal or more unequal?
Case in Point: Attitudes and Inequality
In a fascinating examination of attitudes in the United States and in continental Western Europe, economists Alberto Alesina of Harvard University and George-Marios Angeletos of the
Massachusetts Institute of Technology suggest that attitudes about the nature of income earning can lead to quite different economic systems and outcomes concerning the distribution of
income.
The economists cite survey evidence from the World Values Survey, which concludes that 71% of Americans, and only 40% of Europeans, agree with the proposition: “The poor could become rich if
they worked hard enough.” Further, Americans are much more likely to attribute material success to hard work, while Europeans tend to attribute success to factors such as luck, connections,
and even corruption. The result, according to Professors Alesina and Angeletos, is that Americans select a government that is smaller and engages in less redistributive activity than is
selected by Europeans. Government in continental Western Europe is 50% larger than in the United States, the tax system in Europe is much more progressive than in the United States,
regulation of labor and product markets is more extensive in Europe, and redistributive programs are more extensive in Europe than in the United States. As a result, the income distribution
in Europe is much more equal than in the United States.
People get what they expect. The economists derive two sets of equilibria. Equilibrium in a society in which people think incomes are a result of luck, connections, and corruption turns out
to be precisely that. And, in a society in which people believe incomes are chiefly the result of effort and skill, they are. In the latter society, people work harder and invest more. In the
United States, the average worker works 1,600 hours per year. In Europe, the average worker works 1,200 hours per year.
So, who is right—Americans with their “you get what you deserve” or Europeans with their “you get what luck, connections, and corruption bring you” attitude? The two economists show that
people get, in effect, what they expect. European values and beliefs produce societies that are more egalitarian. American values and beliefs produce the American result: a society in which
the distribution of income is more unequal, the government smaller, and redistribution relatively minor. Professors Alesina and Angeletos conclude that Europeans tend to underestimate the
degree to which people can improve their material well-being through hard work, while Americans tend to overestimate that same phenomenon.
Source: Alberto Alesina and George-Marios Angeletos, “Fairness and Redistribution,” American Economic Review 95:4 (September, 2005) 960–80.
ANSWER TO TRY IT! PROBLEM
The Lorenz curve showing the distribution of income after taxes and benefits are taken into account is less bowed out than the Lorenz curve showing the distribution of income before taxes and
benefits are taken into account. Thus, income is more equally distributed after taking them into account.
- 2181 reads
