


Figure Figure 20.2 shows movements in real GDP in the United States from 1960 to 2008. Over those years, the economy experienced eight recessions (including the current one), shown by the shaded areas in the chart. Although periods of expansion have been more prolonged than periods of recession, we see the cycle of economic activity that characterizes economic life.
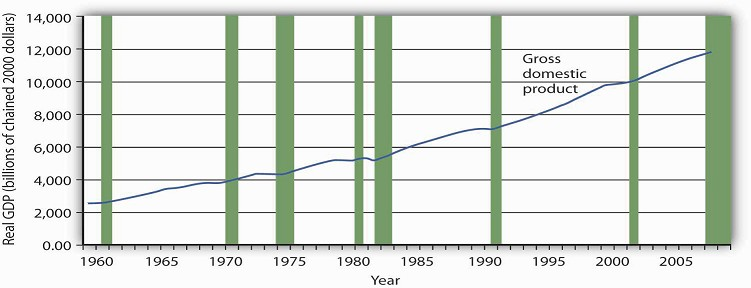
The chart shows movements in real GDP since 1960. Recessions—periods of falling real GDP—are shown as shaded areas. On average, the annual rate of growth of real GDP over the period was 3.3% per year.
Source: Bureau of Economic Analysis, NIPA Table 1.1.6. Real Gross Domestic Product, Chained Dollars [Billions of chained (2000) dollars]. Seasonally adjusted at annual rates. Data for 2008 is through 3rd quarter.
Real GDP clearly grew between 1960 and 2008. While the economy experienced expansions and recessions, its general trend during the period was one of rising real GDP. The average annual rate of growth of real GDP was about 3.3%.
During the post–World War II period, the average expansion has lasted 57 months, and the average recession has lasted about 10 months. The 2001 recession, which lasted eight months, was thus slightly shorter than the average. The current recession is already longer than the average recession.
Economists have sought for centuries to explain the forces at work in a business cycle. Not only are the currents that move the economy up or down intellectually fascinating but also an understanding of them is of tremendous practical importance. A business cycle is not just a movement along a curve in a textbook. It is new jobs for people, or the loss of them. It is new income, or the loss of it. It is the funds to build new schools or to provide better health care—or the lack of funds to do all those things. The story of the business cycle is the story of progress and plenty, of failure and sacrifice.
If current projections that the economy is in for a prolonged downturn prove true, then the job outlook for new college graduates will be grim. Already, students who graduated in the class of 2008 experienced a very difficult job market.
The effects of recessions extend beyond the purely economic realm and influence the social fabric of society as well. Suicide rates and property crimes—burglary, larceny, and motor vehicle theft tend to rise during recessions. Even popular music appears to be affected. Terry F. Pettijohn II, a psychologist at Coastal Carolina University, has studied Billboard No. 1 songs from 1955–2003. He finds that during recessions, popular songs tend to be longer and slower, and to have more serious lyrics. “It’s ‘Bridge over Troubled Water’ or ‘That’s What Friends Are For’,” he says. During expansions, songs tend to be faster, shorter, and somewhat sillier, such as “At the Hop” or “My Sharona.”
In our study of macroeconomics, we will gain an understanding of the forces at work in the business cycle. We will also explore policies through which the public sector might act to make recession less severe and, perhaps, to prolong expansions. We turn next to an examination of price-level changes and unemployment.
KEY TAKEAWAYS
- Real gross domestic product (real GDP) is a measure of the value of all final goods and services produced during a particular year or period, adjusted to eliminate the effects of price changes.
- The economy follows a path of expansion, then contraction, then expansion again. These fluctuations make up the business cycle.
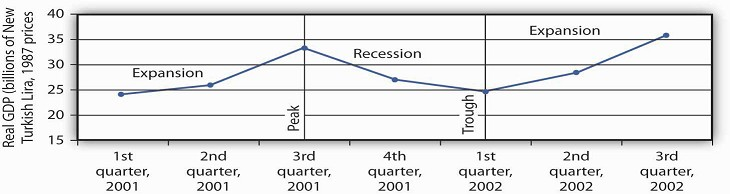
- The point at which an expansion becomes a recession is called the peak of a business cycle; the point at which a recession becomes an expansion is called the trough.
- Over time, the general trend for most economies is one of rising real GDP. On average, real GDP in the United States has grown at a rate of over 3% per year since 1960.
TRY IT!
The data below show the behavior of real GDP in Turkey from the first quarter of 2001 through the third quarter of 2002. Use the data to plot real GDP in Turkey and indicate the phases of the business cycle.
Case in Point: The Art of Predicting Recessions
People who make a living tracking the economy and trying to predict its future do not do a very good job at predicting turning points in economic activity. The 52 economists surveyed by the
Wall Street Journal each month did predict that the economy would slip into a recession in the third quarter of 2008. They made that prediction, however, in October—after the third quarter
had ended. In September, the last month of the third quarter, the average forecast among the 52 economists had the economy continuing to grow through the third and fourth quarters of 2008.
That September survey was taken before the financial crisis hit, a crisis that took virtually everyone by surprise. Of course, as we have already noted, the third-quarter downturn had not
been identified as a recession by the NBER’s Business Cycle Dating Committee as of November of 2008.
Predicting business cycle turning points has always been a tricky business. The experience of the recession of 2001 illustrates this. As the accompanying table shows, even as late as
September 10, 2001, only 13 out of the 100 Blue Chip forecasters had answered in the affirmative to the question, “Has the United States slipped into a recession?” even though we now know the
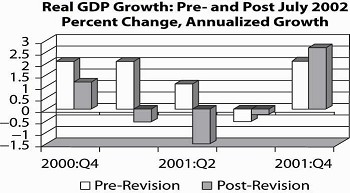
recession had begun the previous March. Comparing the data that were originally released by the U.S. Bureau of Economic Analysis shortly after the end of each quarter with the revised data
that were released after July 2002 provides an important insight into explaining why the forecasters seem to have done so badly. As the graph on pre-revision and post-revision estimates of
real GDP growth shows, the data released shortly after the end of each quarter showed an economy expanding through the second quarter of 2001, whereas the revised data show the economy
contracting modestly in the first quarter of 2001 and then more forcefully in the second quarter. Only after the attacks on the World Trade Center in New York City and the Pentagon in
Washington, D.C., on September 11, 2001, did most of the Blue Chip forecasters realize the economy was in recession.
The National Bureau of Economic Research (NBER) Business Cycle Dating Committee in November 2001 released a press announcement dating the onset of the recession as March 2001. The committee
argued that “before the attacks of September 11, it is possible that the decline in the economy would have been too mild to qualify as a recession. The attacks clearly deepened the
contraction and may have been an important factor in turning the episode into a recession.” While surprising at the time, the revised data suggest that the committee made a good call.
This episode in economic history also points out the difference between the common definition of a recession as two consecutive quarters of declining real GDP and the NBER Dating Committee’s
continued insistence that it does not define a recession in this way. Rather the committee looks not only at real GDP but also at employment, income, and other factors. The behavior of
employment during 2001 seems to have been an important factor in the November 2001 decision to proclaim March 2001 as the peak despite the misleading information on real GDP coming out of the
Bureau of Economic Analysis at the time. The slow pickup in employment may also, though, have made it hesitate to call November 2001 the trough until July 2003.
|
Question posed: “Has the United States slipped into a recession?” |
||
|---|---|---|
|
Date |
Percent of Blue Chip responders answering “Yes” |
Percent of Blue Chip responders answering “No” |
|
February 2001 |
5 |
95 |
|
June 2001 |
7 |
93 |
|
July 2001 |
13 |
87 |
|
August 2001 |
5 |
85 |
|
September 10, 2001 |
13 |
87 |
|
September 19, 2001 |
82 |
18 |
Real GDP Growth: Pre- and Post-July, 2002
Sources: Phil Izzo, “Economists Expect Crisis to Deepen,” Wall Street Journal Online, October 10, 2008; Kevin L. Kliesen, “The 2001 Recession: How Was It Different and What Developments
May Have Caused It?” Federal Reserve Bank of St. Louis Review, September/October 2003: 23–37; http://www.nber.org/cycles/; “Press Release,” Business Cycle Dating Committee, National Bureau of
Economic Research, press release, Cambridge, Massachusetts, July 17, 2002.
ANSWER TO TRY IT! PROBLEM
- 3563 reads
