


Sales of a country’s goods and services to buyers in the rest of the world during a particular time period represent its exports. A purchase by a Japanese buyer of a Ford Taurus produced in the United States is a U.S. export. Exports also include such transactions as the purchase of accounting services from a New York accounting firm by a shipping line based in Hong Kong or the purchase of a ticket to Disney World by a tourist from Argentina. Imports are purchases of foreign-produced goods and services by a country’s residents during a period. United States imports include such transactions as the purchase by Americans of cars produced in Japan or tomatoes grown in Mexico or a stay in a French hotel by a tourist from the United States. Subtracting imports from exports yields net exports.
EQUATION 21.2
Exports (X) -IMPORTS (M) = net exports (Xn)
In the third quarter of 2008, foreign buyers purchased $1,971.3 billion worth of goods and services from the United States. In the same year, U.S. residents, firms, and government agencies purchased $2,677.9 billion worth of goods and services from foreign countries. The difference between these two figures, −$706.6 billion, represented the net exports of the U.S. economy in the third quarter of 2008. Net exports were negative because imports exceeded exports. Negative net exports constitute a trade deficit. The amount of the deficit is the amount by which imports exceed exports. When exports exceed imports there is a trade surplus. The magnitude of the surplus is the amount by which exports exceed imports.
The United States has recorded more deficits than surpluses since World War II, but the amountshave typically been relatively small, only a few billion dollars. The trade deficit began to soar, however, in the 1980s and again in the 2000s. We will examine the reasons for persistent trade deficits in another chapter. The rest of the world plays a key role in the domestic economy and, as we will see later in the book, there is nothing particularly good or bad about trade surpluses or deficits. Goods and services produced for export represent roughly 14% of GDP, and the goods and services the United States imports add significantly to our standard of living.
In the circular flow diagram in Figure Figure 21.4, net exports are shown with an arrow connecting firms to the rest of the world. The balance between the flows of exports and imports is net exports. When there is a trade surplus, net exports are positive and add spending to the circular flow. A trade deficit implies negative net exports; spending flows from firms to the rest of the world.
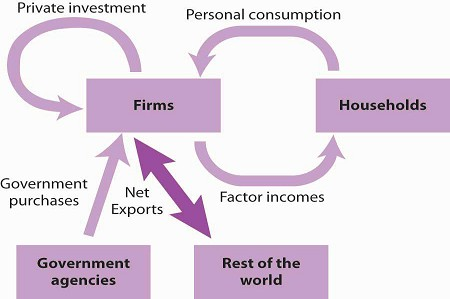
Net exports represent the balance between exports and imports. Net exports can be positive or negative. If they are positive, net export spending flows from the rest of the world to firms. If they are negative, spending flows from firms to the rest of the world.
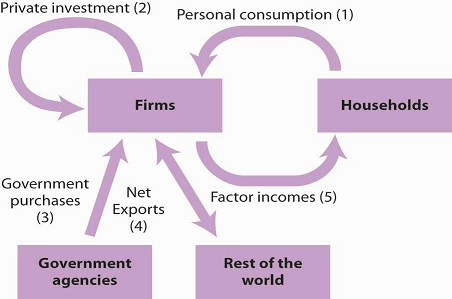
GDP equals the sum of production by firms of goods and services for personal consumption (1), private investment (2), government purchases (3), and net exports (4). The circular flow model shows these flows and shows that the production of goods and services generates factor incomes (5) to households.
The production of goods and services for personal consumption, private investment, government purchases, and net exports makes up a nation’s GDP. Firms produce these goods and services in response to demands from households (personal consumption), from other firms (private investment), from government agencies (government purchases), and from the rest of the world (net exports). All of this production creates factor income for households. Figure Figure 21.5 shows the circular flow model for all the spending flows we have discussed. Each flow is numbered for use in the exercise at the end of this section.
The circular flow model identifies some of the forces at work in the economy, forces that we will be studying in later chapters. For example, an increase in any of the flows that place demands on firms (personal consumption, private investment, government purchases, and exports) will induce firms to expand their production. This effect is characteristic of the expansion phase of the business cycle. An increase in production will require firms to employ more factors of production, which will create more income for households. Households are likely to respond with more consumption, which will induce still more production, more income, and still more consumption. Similarly, a reduction in any of the demands placed on firms will lead to a reduction in output, a reduction in firms’ use of factors of production, a reduction in household incomes, a reduction in income, and so on. This sequence of events is characteristic of the contraction phase of the business cycle. Much of our work in macroeconomics will involve an analysis of the forces that prompt such changes in demand and an examination of the economy’s response to them.
Figure Figure 21.6 shows the size of the components of GDP in 2008. We see that the production of goods and services for personal consumption accounted for about 70% of GDP. Imports exceeded exports, so net exports were negative.
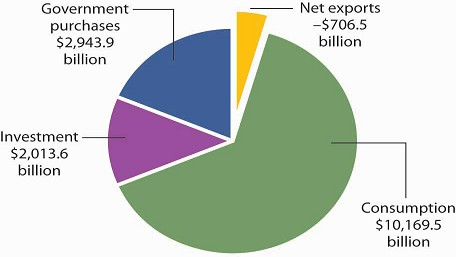
Consumption makes up the largest share of GDP. Net exports were negative in 2008. Total GDP—the sum of personal consumption, private investment, government purchases, and net exports—equaled $14,420.5 billion in 2008.
1.2 Final Goods and Value Added
GDP is the total value of all final goods and services produced during a particular period valued at prices in that period. That is not the same as the total value of all goods and services produced during a period. This distinction gives us another method of estimating GDP in terms of output.
Suppose, for example, that a logger cuts some trees and sells the logs to a sawmill. The mill makes lumber and sells it to a construction firm, which builds a house. The market price for the lumber includes the value of the logs; the price of the house includes the value of the lumber. If we try to estimate GDP by adding the value of the logs, the lumber, and the house, we would be counting the lumber twice and the logs three times. This problem is called “double counting,” and the economists who compute GDP seek to avoid it.
In the case of logs used for lumber and lumber produced for a house, GDP would include the value of the house. The lumber and the logs would not be counted as additional production because they are intermediate goods that were produced for use in building the house.
Another approach to estimating the value of final production is to estimate for each stage of production the value added, the amount by which the value of a firm’s output exceeds the value of the goods and services the firm purchases from other firms. Table 21.1 illustrates the use of value added in the production of a house.
If we sum the value added at each stage of the production of a good or service, we get the final value of the item. The example shown here involves the construction of a house, which is produced from lumber that is, in turn, produced from logs.
|
Good |
Produced by |
Purchased by |
Price |
Value added |
|---|---|---|---|---|
|
Logs |
Logger |
Sawmill |
$12,000 |
$12,000 |
|
Lumber |
sawmill |
Construction firm |
$25,000 |
$13,000 |
|
House |
Construction firm |
Household |
$236,000 |
$100,000 |
|
Final Value |
$125,000 |
|||
|
Sum of Values Added |
$125,000 |
Suppose the logs produced by the logger are sold for $12,000 to a mill, and that the mill sells the lumber it produces from these logs for $25,000 to a construction firm. The construction firm uses the lumber to build a house, which it sells to a household for $125,000. (To simplify the example, we will ignore inputs other than lumber that are used to build the house.) The value of the final product, the house, is $125,000. The value added at each stage of production is estimated as follows:
- The logger adds $12,000 by cutting the logs.
- The mill adds $13,000 ($25,000 − $12,000) by cutting the logs into lumber.
- The construction firm adds $100,000 ($125,000 − $25,000) by using the lumber to build a house.
The sum of values added at each stage ($12,000 + $13,000 + $100,000) equals the final value of the house, $125,000.
The value of an economy’s output in any period can thus be estimated in either of two ways. The values of final goods and services produced can be added directly, or the values added at each stage in the production process can be added. The Commerce Department uses both approaches in its estimate of the nation’s GDP.
- 2773 reads
