


The model of aggregate demand and long-run aggregate supply predicts that the economy will eventually move toward its potential output. To see how nominal wage and price stickiness can cause real GDP to be either above or below potential in the short run, consider the response of the economy to a change in aggregate demand. Figure 22.7 shows an economy that has been operating at potential output of $12,000 billion and a price level of 1.14. This occurs at the intersection of AD1 with the long-run aggregate supply curve at point B. Now suppose that the aggregate demand curve shifts to the right (to AD2). This could occur as a result of an increase in exports. (The shift from AD1 to AD2 includes the multiplied effect of the increase in exports.) At the price level of 1.14, there is now excess demand and pressure on prices to rise. If all prices in the economy adjusted quickly, the economy would quickly settle at potential output of $12,000 billion, but at a higher price level (1.18 in this case).
Is it possible to expand output above potential? Yes. It may be the case, for example, that some people who were in the labor force but were frictionally or structurally unemployed find work because of the ease of getting jobs at the going nominal wage in such an environment. The result is an economy operating at point A in Figure 22.7 at a higher price level and with output temporarily above potential.
Consider next the effect of a reduction in aggregate demand (to AD3), possibly due to a reduction in investment. As the price level starts to fall, output also falls. The economy finds itself at a price level– output combination at which real GDP is below potential, at point C. Again, price stickiness is to blame. The prices firms receive are falling with the reduction in demand. Without corresponding reductions in nominal wages, there will be an increase in the real wage. Firms will employ less labor and produce less output.
By examining what happens as aggregate demand shifts over a period when price adjustment is incomplete, we can trace out the short-run aggregate supply curve by drawing a line through points A, B, and C. The short-run aggregate supply (SRAS) curve is a graphical representation of the relationship between production and the price level in the short run. Among the factors held constant in drawing a short-run aggregate supply curve are the capital stock, the stock of natural resources, the level of technology, and the prices of factors of production.
A change in the price level produces a change in the aggregate quantity of goods and services supplied and is illustrated by the movement along the short-run aggregate supply curve. This occurs between points A, B, and C in Figure 22.7.
A change in the quantity of goods and services supplied at every price level in the short run is a change in short-run aggregate supply. Changes in the factors held constant in drawing the shortrun aggregate supply curve shift the curve. (These factors may also shift the long-run aggregate supply curve; we will discuss them along with other determinants of long-run aggregate supply in the next chapter.)
One type of event that would shift the short-run aggregate supply curve is an increase in the price of a natural resource such as oil. An increase in the price of natural resources or any other factor of production, all other things unchanged, raises the cost of production and leads to a reduction in shortrun aggregate supply. In Panel (a) of Figure 22.6, SRAS1 shifts leftward to SRAS2. A decrease in the price of a natural resource would lower the cost of production and, other things unchanged, would allow greater production from the economy’s stock of resources and would shift the short-run aggregate supply curve to the right; such a shift is shown in Panel (b) by a shift from SRAS1 to SRAS3.
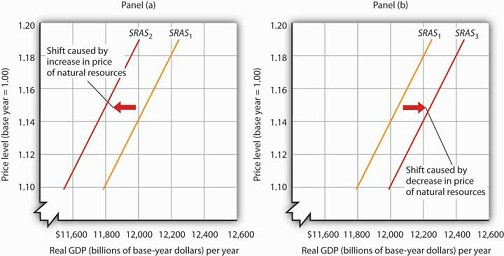
A reduction in short-run aggregate supply shifts the curve from SRAS1 to SRAS2 in Panel (a). An increase shifts it to the right to SRAS3, as shown in Panel (b).
- 3852 reads
