


Economic growth is a long-run process that occurs as an economy’s potential output increases. Changes in real GDP from quarter to quarter or even from year to year are short-run fluctuations that occur as aggregate demand and short-run aggregate supply change. Regardless of media reports stating that the economy grew at a certain rate in the last quarter or that it is expected to grow at a particular rate during the next year, short-run changes in real GDP say little about economic growth. In the long run, economic activity moves toward its level of potential output. Increases in potential constitute economic growth.
Earlier we defined economic growth as the process through which an economy achieves an outward shift in its production possibilities curve. How does a shift in the production possibilities curve relate to a change in potential output? To produce its potential level of output, an economy must operate on its production possibilities curve. An increase in potential output thus implies an outward shift in the production possibilities curve. In the framework of the macroeconomic model of aggregate demand and aggregate supply, we show economic growth as a shift to the right in the long-run aggregate supply curve.
There are three key points about economic growth to keep in mind:
- Growth is a process. It is not a single event; rather, it is an unfolding series of events.
- We define growth in terms of the economy’s ability to produce goods and services, as indicated by its level of potential output.
- Growth suggests that the economy’s ability to produce goods and services is rising. A discussion of economic growth is thus a discussion of the series of events that increase the economy’s ability to produce goods and services.
Figure 23.1 shows the record of economic growth for the U.S. economy over the past century. The graph shows annual levels of actual real GDP and of potential output. We see that the economy has experienced dramatic growth over the past century; potential output has soared more than 30-fold. The figure also reminds us of a central theme of our analysis of macroeconomics: real GDP fluctuates about potential output. Real GDP sagged well below its potential during the Great Depression of the 1930s and rose well above its potential as the nation mobilized its resources to fight World War II. With the exception of these two periods, real GDP has remained close to the economy’s potential output. Since 1950, the actual level of real GDP has deviated from potential output by an average of less than 2%.
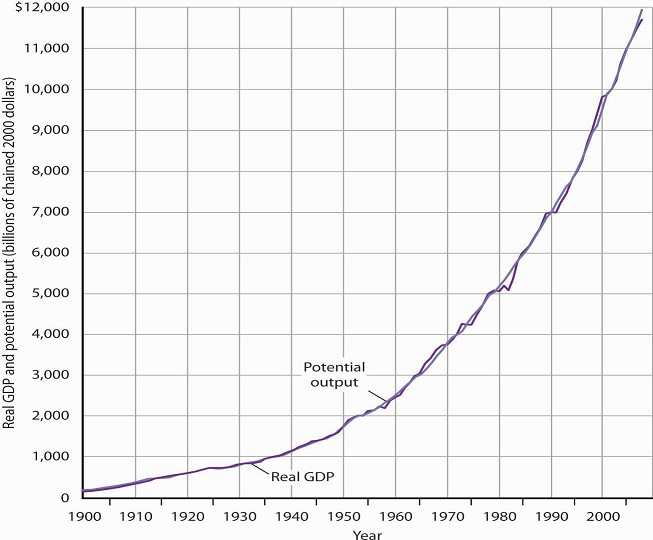
Source: 1900–1949 data from Robert Gordon, Macroeconomics, 6th ed. (New York: HarperCollins, 1993), Table A-1, pp. A1–A3; data for 1950–2008 from Congressional Budget Office, The Budget and Economic Outlook, September 2008.
We urge you to take some time with Figure 23.1. Over the course of the last century, it is economic growth that has taken center stage. Certainly, the fluctuations about potential output have been important. The recessionary gaps—periods when real GDP slipped below its potential—were often wrenching experiences in which millions of people endured great hardship. The inflationary gaps— periods when real GDP rose above its potential level—often produced dramatic increases in price levels. Those fluctuations mattered. It was the unemployment and/or the inflation that came with them that made headlines. But it was the quiet process of economic growth that pushed living standards ever higher. We must understand growth if we are to understand how we got where we are, and where we are likely to be going during the 21st century.
Figure 23.2 tells us why we use changes in potential output, rather than actual real GDP, as our measure of economic growth. Actual values of real GDP are affected not just by changes in the potential level of output, but also by the cyclical fluctuations about that level of output.
Given our definition of economic growth, we would say that the hypothetical economy depicted in Figure 23.2 grew at a 2.5% annual rate throughout the period. If we used actual values of real GDP, however, we would obtain quite different interpretations. Consider, for example, the first decade of this period: it began with a real GDP of $900 billion and a recessionary gap, and it ended in year 10 with a real GDP of $1,408 billion and an inflationary gap. If we record growth as the annual rate of change between these levels, we find an annual rate of growth of 4.6%—a rather impressive performance.
Now consider the second decade shown in Figure 23.2. It began in year 10, and it ended in year 20 with a recessionary gap. If we measure the growth rate over that period by looking at beginning and ending values of actual real GDP, we compute an annual growth rate of 0.5%. Viewed in this way, performance in the first decade is spectacular while performance in the second is rather lackluster. But these figures depend on the starting and ending points we select; the growth rate of potential output was 2.5% throughout the period.
By measuring economic growth as the rate of increase in potential output, we avoid such problems. One way to do this is to select years in which the economy was operating at the natural level of employment and then to compute the annual rate of change between those years. The result is an estimate of the rate at which potential output increased over the period in question. For the economy shown in Figure 23.2, for example, we see that real GDP equaled its potential in years 5 and 15. Real GDP in year 5 was $1,131, and real GDP in year 15 was $1,448. The annual rate of change between these two years was 2.5%. If we have estimates of potential output, of course, we can simply compute annual rates of change between any two years.
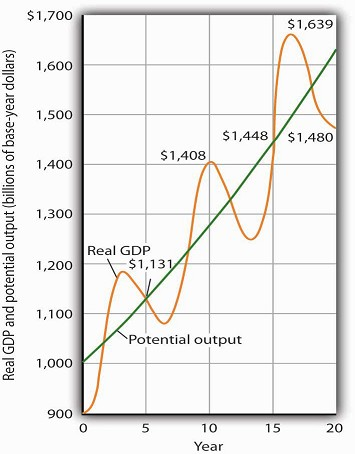
The use of actual values of real GDP to measure growth can give misleading results. Here, an economy’s potential output (shown in green) grows at a steady rate of 2.5% per year, with actual values of real GDP fluctuating about that trend. If we measure growth in the first 10 years as the annual rate of change between beginning and ending values of real GDP, we get a growth rate of 3.5%. The rate for the second decade is 0.5%. Growth estimates based on changes in real GDP are affected by cyclical changes that do not represent economic growth.
- 3080 reads
