


Suppose the manager of a manufacturing company needs to borrow some money to expand the factory. The manager could do so in the following way: he or she prints, say, 500 pieces of paper, each bearing the company’s promise to pay the bearer $1,000 in a year. These pieces of paper are bonds, and the company, as the issuer, promises to make a single payment. The manager then offers these bonds for sale, announcing that they will be sold to the buyers who offer the highest prices. Suppose the highest price offered is $950, and all the bonds are sold at that price. Each bond is, in effect, an obligation to repay buyers $1,000. The buyers of the bonds are being paid $50 for the service of lending $950 for a year.
The $1,000 printed on each bond is the face value of the bond; it is the amount the issuer will have to pay on the maturity date of the bond—the date when the loan matures, or comes due. The $950 at which they were sold is their price. The difference between the face value and the price is the amount paid for the use of the money obtained from selling the bond.
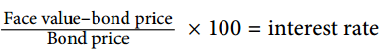
An interest rate is the payment made for the use of money, expressed as a percentage of the amount borrowed. Bonds you sold command an interest rate equal to the difference between the face value and the bond price, divided by the bond price, and then multiplied by 100 to form a percentage:
EQUATION 25.1
At a price of $950, the interest rate is 5.3%
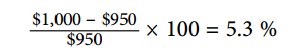
The interest rate on any bond is determined by its price. As the price falls, the interest rate rises. Suppose, for example, that the best price the manager can get for the bonds is $900. Now the interest rate is 11.1%. A price of $800 would mean an interest rate of 25%; $750 would mean an interest rate of 33.3%; a price of $500 translates into an interest rate of 100%. The lower the price of a bond relative to its face value, the higher the interest rate.
Bonds in the real world are more complicated than the piece of paper in our example, but their structure is basically the same. They have a face value (usually an amount between $1,000 and $100,000) and a maturity date. The maturity date might be three months from the date of issue; it might be 30 years.
Whatever the period until it matures, and whatever the face value of the bond may be, its issuer will attempt to sell the bond at the highest possible price. Buyers of bonds will seek the lowest prices they can obtain. Newly issued bonds are generally sold in auctions. Potential buyers bid for the bonds, which are sold to the highest bidders. The lower the price of the bond relative to its face value, the higher the interest rate.
Both private firms and government entities issue bonds as a way of raising funds. The original buyer need not hold the bond until maturity. Bonds can be resold at any time, but the price the bond will fetch at the time of resale will vary depending on conditions in the economy and the financial markets.
Figure 25.1 illustrates the market for bonds. Their price is determined by demand and supply. Buyers of newly issued bonds are, in effect, lenders. Sellers of newly issued bonds are borrowers—recall that corporations, the federal government, and other institutions sell bonds when they want to borrow money. Once a newly issued bond has been sold, its owner can resell it; a bond may change hands several times before it matures.
Bonds are not exactly the same sort of product as, say, broccoli or some other good vor service. Can we expect bonds to have the same kind of downward-sloping demand curves and upward-sloping supply curves we encounter for ordinary goods and services? Yes. Consider demand. At lower prices, bonds pay higher interest. That makes them more attractive to buyers of bonds and thus increases the quantity demanded. On the other hand, lower prices mean higher costs to borrowers—suppliers of bonds—and should reduce the quantity supplied. Thus, the negative relationship between price and quantity demanded and the positive relationship between price and quantity supplied suggested by conventional demand and supply curves holds true in the market for bonds.
If the quantity of bonds demanded is not equal to the quantity of bonds supplied, the price will adjust almost instantaneously to balance the two. Bond prices are perfectly flexible in that they change immediately to balance demand and supply. Suppose, for example, that the initial price of bonds is $950, as shown by the intersection of the demand and supply curves in Figure 25.1. We will assume that all bonds have equal risk and a face value of $1,000 and that they mature in one year. Now suppose that borrowers increase their borrowing by offering to sell more bonds at every interest rate. This increases the supply of bonds: the supply curve shifts to the right from S1 to S2. That, in turn, lowers the equilibrium price of bonds—to $900 in Figure 25.1. The lower price for bonds means a higher interest rate.
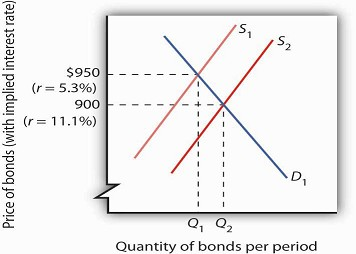
The equilibrium price for bonds is determined here the demand and supply curves intersect. The initial solution here is a price of 950, implying an interest rate of 5.3%. An increase in borrowing, all other things equal, increases the supply of bonds to S2 and forces the price of bonds down to $900. The interest rate rises to 11.1%.
- 2199 reads
