


The Fourier series representation of a periodic signal makes it easy to determine how a linear, time-invariant filter reshapes such signals in general. The
fundamental property of a linear system is that its input-output relation obeys superposition: L (a1s1 (t)+
a2s2 (t)) = a1L (s1 (t)) + a2L (s2 (t)). Because the
Fourier series represents a periodic signal as a linear combination of complex exponentials, we can exploit the superposition property. Furthermore, we found for linear circuits that their
output to a complex exponential input is just the frequency response evaluated at the signal's frequency times the complex exponential. Said mathematically, if  , then the output
  because
  . Thus, if x(t) is periodic thereby
having a Fourier series, a linear circuit's output to this signal will be the superposition of the output to each component.
Thus, the output has a Fourier series, which means that it too is periodic. Its Fourier coefficients equal ckH ( ) . To obtain the spectrum of the output, we simply
multiply the input spectrum by the frequency response. The circuit modifies the magnitude and phase of each Fourier coefficient. Note especially that while the Fourier coefficients do
not depend on the signal's period, the circuit's transfer function does depend on frequency, which means that the circuit's output will differ as the period varies.
) . To obtain the spectrum of the output, we simply
multiply the input spectrum by the frequency response. The circuit modifies the magnitude and phase of each Fourier coefficient. Note especially that while the Fourier coefficients do
not depend on the signal's period, the circuit's transfer function does depend on frequency, which means that the circuit's output will differ as the period varies.
Example 4.3
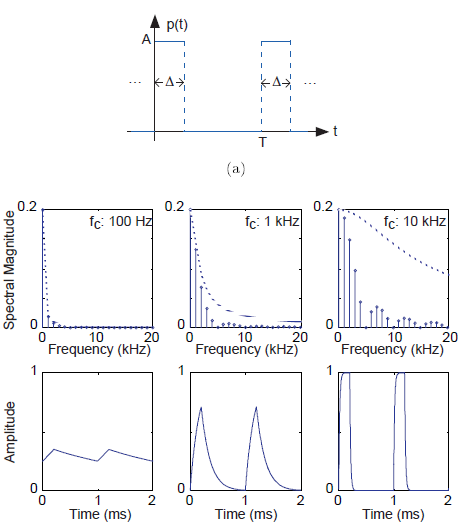
The periodic pulse signal shown on the left above serves as the input to a RC-circuit that has the transfer function (calculated elsewhere (Figure 3.30: Magnitude and phase of the transfer
function))
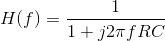
Figure 4.10 shows the output changes as we vary the filter’s cutoff frequency. Note how the signal's spectrum extends well above its fundamental frequency. Having a cutoff frequency ten times higher than the fundamental does perceptibly change the output waveform, rounding the leading and trailing edges. As the cutoff frequency decreases (center, then left), the rounding becomes more prominent, with the leftmost waveform showing a small ripple.
Exercise 4.7.1
What is the average value of each output waveform? The correct answer may surprise you.
This example also illustrates the impact a lowpass filter can have on a waveform. The simple RC filter used here has a rather gradual frequency response, which means that higher harmonics are smoothly suppressed. Later, we will describe filters that have much more rapidly varying frequency responses, allowing a much more dramatic selection of the input's Fourier coefficients.
More importantly, we have calculated the output of a circuit to a periodic input without writing, much less solving, the differential equation governing the circuit's behavior. Furthermore, we made these calculations entirely in the frequency domain. Using Fourier series, we can calculate how any linear circuit will respond to a periodic input.
- 4011 reads
