


As an example, we propose an e-learning scenario for students in medicine and health care. A learner that traverses such a scenario will be able to apply a binomial distributional model in studying the chance of patients suffering from a particular type of cancer, to survive for at least a six month period after diagnosis. We would have to appeal to previous studies and information from actual databases to assess the chances of a patient surviving. This might indicate, for instance, that the probability of survival is p = 0.3, and consequently the complementary probability of death is q = 1 – p = 0.7. In real life, we are frequently interested what might happen to a group of patients we are studying. For example, we may formulate the following problem, as a piece of the current e-learning scenario:
"Of the 11 patients in a particular cancer program, what is the chance of 7 or more of them surviving at least six months past diagnosis?"
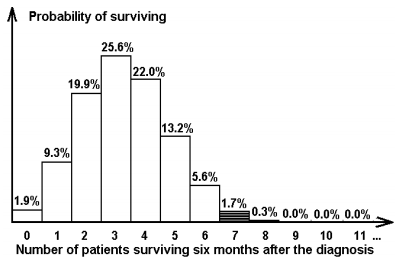
If pk is the probability that k patients survives (where k≤11), to solve the previous problem we have to compute the sum P = p7+p8+p9+p10+p11. The binomial distribution B (11, 0.3) can be applied to calculate these probabilities. If the learner is a beginner in Probabilities and Statistics, maybe needs to get immediately an explanatory text about binomial distribution B (n, p). Then it is possible to directly apply the formula and compute the probabilities for binomial B (11, 0.3). Using the formula pk = 11!/(k!(11-k)!)(0.3)k (0.7)11-k, for k≦11, one obtain the values p7 ≈ 0.017, p8 ≈ 0.003, and p9 ≈ p10 ≈p11 ≈ 0. Finally, the learner can give the solution for the previous problem: P = 0.017 + 0.003 = 0.02. The e-learning scenario may be resourceful in showing additional information when necessary. The learner may ask whenever for any information, but intelligent software tool may have also the initiative to show some information when it considers that is an adequate moment. We think that Bayesian inference is suitable for deciding when the learner needs some supplementary information. We have to combine Bayesian inference with a sort of intelligent agents, to prepare and to configure a suggestive visualization, based on a friendly and efficient dialogue with the learner. As an example, for any learner may be useful to see a visualization of the previous probabilities pk, where k € {0, 1, 2, ..., 11}, in a very suggestive column format, and to recognize the solution to previous problem shown with dashed columns (Figure 3.16).
The previous distribution model, which is binomial distribution B (11, 0.3), may also be applied in an e-learning scenario for students in pharmacy. For example, suppose they have to test the effect of a dose of digitalis on frogs. In this case, the problem can be formulated as follows:
"Injection of a certain dose of digitalis per unit of body weight into a large number of frogs causes the death of 30% of them. What is the probability that the number of deaths will be 7 or more, when this dose is injected into each of a group of 11 frogs?"
It is obvious that we may use the same statistical template to create a similar e-learning scenario for students in pharmacy, but with specific texts.
- 2451 reads
