


We modelled the flow of patients through chronic diseases departments (Gorunescu et al.,2002) and based on these models we created e-learning scenarios. The planning of medical service within a chronic healthcare department is a complex problem the staffs has to face because patients of long-term services occupy the beds for long periods of time and a high quality medical care costs a lot of money. Under these circumstances, a balanced policy between a high quality service measured by the number of beds and suitable costs becomes a necessity for the administration in order to get full value for the money they have spent. With this end in view, using the simulation of distributional models and stochastic processes, we modelled the patient flow through chronic diseases departments. The use of stochastic compartmental analysis, which assumes probabilistic behaviour of the patients around the system, is considered a more realistic representation of an actual situation rather than simpler deterministic model. In order to simulate the model, we have split it into two parts: the arrival of patients and the in-patient care. Patients are initially admitted into acute care consisting of diagnosis, assessment and rehabilitation. The most of patients either are released and therefore re-enter the community, or die after such a period of acute care. However, a certain number of patients may be considered to be unable to look after themselves, and therefore pass from acute into long-stay care where they may remain for a considerable amount of time, or they will eventually die.
The arrival of patients is modelled as a Poisson process with a parameter estimated by using the inter-arrival times (Prodan et al., 1999). These times are independent exponential random
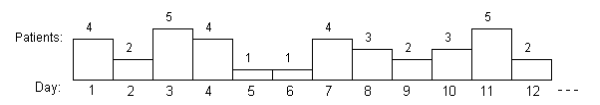
variables, each with parameter λ (the rate of arriva ls) and with the corresponding density function  Figure 3.21 shows a simulation of the Poisson arrivals at rate λ = 2.75 per day.
The in-patient care time is modelled as a mixed-exponential phase-type distribution, where the number of terms in the mixture corresponds to the number of stages of patient care. A common
scenario is that there are two stages for in-patient care: acute and long-stay, composing in this case two exponential distributions with parameters  and
and  , representing the corresponding access rate for each stage. In this
case, the mixed exponential phase-type distribution has the density function
, representing the corresponding access rate for each stage. In this
case, the mixed exponential phase-type distribution has the density function  which implies a mean care time of
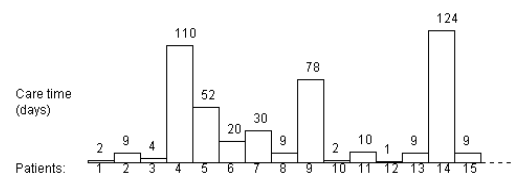
  days per patient (Prodan et al., 2000). Figure 3.22 shows a simulation for the in-patient care time with parameters ρ = 0.93,
 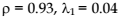 and
and , resulting a mean care time of 93.25 days per
patient.
, resulting a mean care time of 93.25 days per
patient.
This model enables us to study the whole system of geriatric care and can be used to look at the time patients spend in hospital and the subsequent time patients spend in the community. Interesting real phenomena can be studied during simulation experiences, such as rejection at entrance due to a brimful department, the resources being limited. Both medical staff and hospital administrators agreed that such a model could be used to maximize the efficiency of the chronic diseases departments and to optimize the use of hospital resources in order to improve hospital care. We used this model in training health care teams, based on e-learning technologies.
- 2641 reads
