


The model of the most effective way of studying, according to the different learning modalities is defined in the space of the learning process state. The space is three-dimensional and each of the axes presents the effectiveness vector, which is defined as ranged triad from:
{discipline, course version for a given discipline, the prognosticated assessment for effectiveness of the e-learning process}.
The goal of the modelling process is to define and to visualize the surface of the effective e-learning by prognosis assessment for the e-learning effectiveness.
The prognosis is realized by comparison between two vectors on the basis of scalar subtraction:
-Vector of the teaching impact and
-Vector of the student’s learning style
The Vector of the teaching impact in the model presents the quantitative assessment of the teaching characteristics of each version of the courses. The Vector of the teaching impact and the Vector of the student’s learning style are chosen with one and a same dimension – (L), and each of the coordinates (p) from 1 to L presents a connected set of properties impact/modality, respectively for the Vector of the teaching impact and the Vector of the learning style. For example if property 1 of the Vector of the teaching impact presents“presenting the new knowledge by graphics”, then the Vector of the learning style will be defined as an analogical modality “ability of the student to learn effectively by graphical presentation of the new knowledge”.
In this way other modalities and approaches for data presentation could be defined andpresented in the model such as: presentation and absorption of knowledge by text description, voice and sound, animation, problem solving, simulators, games, etc.
An unique Vector of teaching impact VEij(1,L) is defined for each version j of a given course i . A Vector of learning style VSk(1,L) is formed For each student k
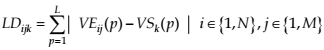
The prognosis assessment of the e-learning effectiveness for each version j of each course I and student k - LDijk is defined by the following formula (15):
For each student k, М-scalar assessment is processed and according to (16) the course version  is found where the scalar assessment is minimal:
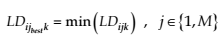
The minimal value of the scalar assessment corresponds to the minimal absolute discrepancy between the teaching impact of the concrete course version and the learning style of the k-student.
Applying criterion (16) for each course 
most appropriate for the k-student’s learning style course versions are formed.
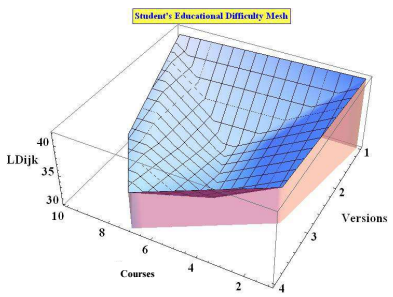
In visualizing the 3D model the points, which are presented with ranged triad coordinates for the k-student are approximated with parts of planes– Figure 4.1 : {i-course, j-version,  - scalar assessment according (15)}
The graphical result of the visualization presents applying the criterion (16) and the possibility to prognosticate the way of defining  versions for i courses. The presented result is a surface of the
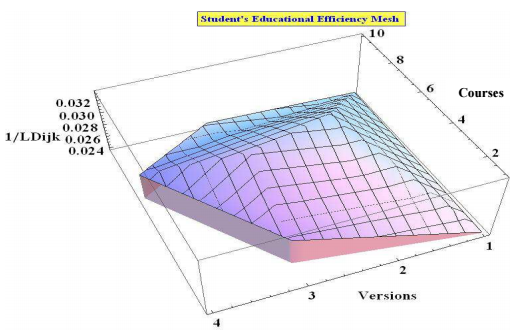
effective e-learning. Very clear marked local minimums present the versions of the courses, for which the k-student will have least difficulties in absorbing the learning content and the
effectiveness of the learning process is expected to be maximal- Figure 4.1 & Figure 4.2shows the opposite – the course versions for the same student, which are most difficult for him, according to his
learning style. The learning styles used for visualizing the model are exemplary. It is not subject of this chapter to present tools and methods for defining learning styles.
versions for i courses. The presented result is a surface of the
effective e-learning. Very clear marked local minimums present the versions of the courses, for which the k-student will have least difficulties in absorbing the learning content and the
effectiveness of the learning process is expected to be maximal- Figure 4.1 & Figure 4.2shows the opposite – the course versions for the same student, which are most difficult for him, according to his
learning style. The learning styles used for visualizing the model are exemplary. It is not subject of this chapter to present tools and methods for defining learning styles.
The presented results in Figure 4.1 and Figure 4.2 are for one student, 10 courses in the curriculum and from 1 to 5 versions for each course.
- 瀏覽次數:2013
