


The demand curve in Figure
3.1 is drawn for a given level of other prices, incomes, tastes, and expectations. Movements along the demand curve reflect solely the impact of different prices for the good in
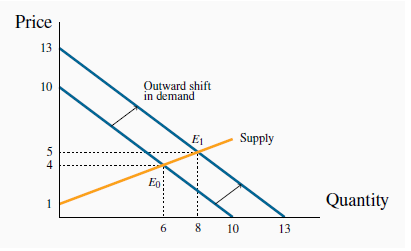
question, holding other influences constant. But changes in any of these other factors will change the position of the demand curve. Figure 3.2 illustrates a shift in the demand curve. This shift could result from a rise in
household incomes that increase the quantity demanded at every price. This is illustrated by an outward shift in the demand curve. With supply conditions unchanged, there is a new equilibrium
at  , indicating a greater quantity of
purchases accompanied by a higher price. The new demand curve reflects a change in the quantity demanded.
, indicating a greater quantity of
purchases accompanied by a higher price. The new demand curve reflects a change in the quantity demanded.
The outward shift in demand leads to a new equilibrium  .
.
Application Box: Corn prices and demand shifts
In the middle of its second mandate, the Bush Administration in the US decided to encourage the production of ethanol – a fuel that is less polluting than gasoline. The target production was 35 billion for 2017 – from a base of 1 billion gallons in 2000. Corn is the principal input in ethanol production. It is used primarily as animal feed, as a sweetener and a food for humans. The target was to be met with the help of a subsidy to producers and a tariff on imports of Brazil’s sugar-cane based ethanol.
The impact on corn prices was immediate; from a farm-gate price of $2 per bushel in 2005, the price reached the $4 range two years later, despite a significant increase in production. In 2012 the price is $7. While other factors, such as growing incomes, have stimulated the demand for corn; ethanol is seen as the main price driver.
The wider impact of these developments was that the prices of virtually all grains increased in tandem with corn. For example, the prices of sorghum and barley increased because of a switch in land use towards corn. Corn was seen as more profitable, less acreage was allocated to other grains, and the supply of these other grains fell.
While producer benefited from the price rise, consumers – particularly those in less developed economies – experienced a dramatic increase in their basic living costs. Visit the site of the United Nations’ Food and Agricultural Organization for an assessment.
In terms of supply and demand shifts, the demand side has dominated. The ethanol drive, combined with secular growth in the demand for food, means that the demand for grains shifted outward faster than the supply, as illustrated in Figure 3.4 below.
- 4036 reads
