


The sum of each participant’s surplus in the final column of Table 5.1 defines the total surplus in the market. Hence, on the demand side a total surplus arises of $1000 and on the supply side a value of $500.
However, we do not always think of demand and supply functions in terms of the steps illustrated in Figure 5.1. Usually there are so many participants in the market that the differences in reservation prices on the supply side and willingness to pay on the demand side are exceedingly small, and so the demand and supply curves are drawn as continuous lines. So let us see how to compute the surpluses where the forms of the demand and supply curves are known. Let the equations for the curves be given by
Demand: P = 1000 - 100Q
Supply: P = 250+50Q
To find the market equilibrium, the two functions are equated and solved:

Therefore,
Q = 750/150 = 5.
At a quantity traded of five units, we can find the corresponding price by substituting it into the demand or supply function; the resulting equilibrium price is $500. In this example we have deliberately used two functions that yield the same equilibrium as the apartment example, and these functions are illustrated in Figure 5.2.
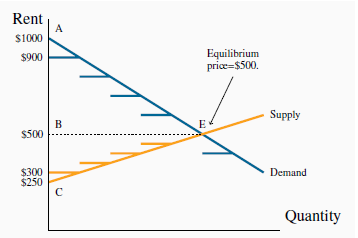
With the linear demand and supply curves that assume the good is divisible the consumer surplus is AEB and the supplier surplus is BEC. This exceeds the surplus computed as the sum of rectangular areas.
The consumer surplus (CS) is the difference between the demand curve and the equilibrium price (ABE), and is computed by using the standard formula for the area of a triangle—half the base multiplied by the perpendicular height, and this yields a value of $1250.
The suppliers’ surplus is the area BEC. This is computed as:
Before progressing it is useful to note that the numerical values we obtain here differ slightly from the values in Table 5.1. The reason is straightforward to see: the area under the demand curve is slightly greater than the sum of the several rectangular areas, each associated with one market participant. This is equally true on the supply side.
The total surplus that arises in the market is the sum of producer and consumer surpluses.
- 2929 reads
