


A quota is a limit placed upon the amount of a good that can be imported. Consider Figure 15.6, where again there is a domestic supply curve coupled with a world price of P. Rather than imposing a tariff, the government imposes a quota that restricts imports to a physical amount denoted by the distance quota on the quantity axis. The supply curve facing domestic consumers then has several segments to it. First it has the segment RC, reflecting the fact that domestic suppliers are competitive with world suppliers up to the amount C. Beyond this output, world suppliers can supply at a price of P, whereas domestic suppliers cannot compete at this price. Therefore the supply curve becomes horizontal, but only up to the amount permitted under the quota—the quantity CU corresponding to quota. Beyond this amount, international supply is not permitted and therefore additional amounts are supplied by the (higher cost) domestic suppliers. Hence the supply curve to domestic buyers becomes the supply curve from the domestic suppliers once again.
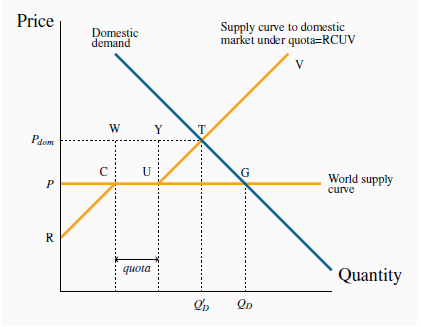
At the world price P, plus a quota, the supply curve becomes RCUV. This has three segments: (i) domestic suppliers who can supply below P; (ii) quota; and (iii) domestic suppliers who can only
supply at a price above P. The quota equilibrium is at T, with price  and quantity traded
  ; the free-trade equilibrium is at G. Of the amount
  , quota is supplied by foreign suppliers and the remainder by domestic suppliers. The quota increases the price in the domestic
market.
, quota is supplied by foreign suppliers and the remainder by domestic suppliers. The quota increases the price in the domestic
market.
The resulting supply curve yields an equilibrium quantity  . There
are several features to note about this equilibrium. First, the quota pushes the domestic price above the world price because low-cost international suppliers are partially supplanted by
higher-cost domestic suppliers. Second, if the quota is chosen ‘appropriately’, the same domestic market price could exist under the quota as under the tariff in Figure 15.4. Third, in contrast to the tariff case,
the government obtains no tax revenue from the quotas. Fourth, there are inefficiencies associated with the equilibrium at
. There
are several features to note about this equilibrium. First, the quota pushes the domestic price above the world price because low-cost international suppliers are partially supplanted by
higher-cost domestic suppliers. Second, if the quota is chosen ‘appropriately’, the same domestic market price could exist under the quota as under the tariff in Figure 15.4. Third, in contrast to the tariff case,
the government obtains no tax revenue from the quotas. Fourth, there are inefficiencies associated with the equilibrium at  : consumers lose the amount
  in surplus. Against this, suppliers gain
  (domestic suppliers gain the amount
  +UYT, which represents the excess of market price over their “willingness to supply” price; the holders of the quota can import at
a price P and sell at Pdom, and therefore gain a surplus equal to CUYW). Therefore the deadweight loss of the quota is the area UTG—the difference between the loss in consumer surplus and the
gain in supplier surplus.
+UYT, which represents the excess of market price over their “willingness to supply” price; the holders of the quota can import at
a price P and sell at Pdom, and therefore gain a surplus equal to CUYW). Therefore the deadweight loss of the quota is the area UTG—the difference between the loss in consumer surplus and the
gain in supplier surplus.
Application Box: Cheese quota in Canada
In 1978 the federal government set a cheese import quota for Canada at just over 20,000 tonnes. This quota was implemented initially to protect the interests of domestic suppliers. Despite a strong growth in population and income in the intervening decades, the import quota has remained unchanged. The result is a price for cheese that is considerably higher than it would otherwise be. The quotas are owned by individuals and companies who have the right to import cheese. The quotas are also traded among importers, at a price. Importers wishing to import cheese beyond their available quota pay a tariff of about 250 percent. So, while the consumer is the undoubted loser in this game, who gains?
First the suppliers gain, as illustrated in Figure 15.6. Canadian consumers are required to pay high-cost domestic producers who displace lower-cost producers from overseas. Second, the holders of the quotas gain. With the increase in demand for cheese that comes with higher incomes, the domestic price increases over time and this in turn makes a quota more valuable.
- 5365 reads
