


Figure 7.12 showed Janet Bain’s utility-maximizing solution for skiing and horseback riding. She achieved it by selecting a point at which an indifference curve was tangent to her budget line. A change in the price of one of the goods, however, will shift her budget line. By observing what happens to the quantity of the good demanded, we can derive Ms. Bain’s demand curve.
Panel (a) of Figure 7.13 shows the original solution at point X, where Ms. Bain has $250 to spend and the price of a day of either skiing or horseback riding is $50. Now suppose the price of horseback riding falls by half, to $25. That changes the horizontal intercept of the budget line; if she spends all other money on horseback riding, she can now ride 10 days per semester. Another way to think about the new budget line is to remember that its slope is equal to the negative of the price of the good on the horizontal axis divided by the price of the good on the vertical axis. When the price of horseback riding (the good on the horizontal axis) goes down, the budget line becomes flatter. Ms. Bain picks a new utility-maximizing solution at point Z.
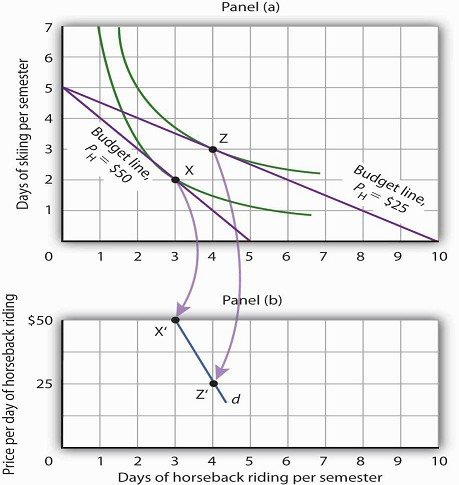
By observing a consumer’s response to a change in price, we can derive the consumer’s demand curve for a good.Panel (a) shows that at a price for horseback riding of $50 per day, Janet Bain chooses to spend 3 days horsebackriding per semester. Panel (b) shows that a reduction in the price to $25 increases her quantity demanded to 4 days per semester. Points X and Z, at which Ms. Bain maximizes utility at horseback riding prices of $50 and $25,respectively, become points X′ and Z′ on her demand curve, d, for horseback riding in Panel (b).
The solution at Z involves an increase in the number of days Ms. Bain spends horseback riding. Notice that only the price of horseback riding has changed; all other features of the utility-maximizing solution remain the same. Ms. Bain’s budget and the price of skiing are unchanged; this is reflected in the fact that the vertical intercept of the budget line remains fixed. Ms. Bain’s preferences are unchanged;they are reflected by her indifference curves. Because all other factors in the solution are unchanged, wecan determine two points on Ms. Bain’s demand curve for horseback riding from her indifference curve diagram. At a price of $50, she maximized utility at point X, spending 3 days horseback riding per semester. When the price falls to $25, she maximizes utility at point Z, riding 4 days per semester.Those points are plotted as points X′ and Z′ on her demand curve for horseback riding in Panel (b) of Figure 7.13.
KEY TAKEAWAYS
- A budget line shows combinations of two goods a consumer is able to consume, given a budget constraint.
- An indifference curve shows combinations of two goods that yield equal satisfaction.
- To maximize utility, a consumer chooses a combination of two goods at which an indifference curve is tangent to the budget line.
- At the utility-maximizing solution, the consumer’s marginal rate of substitution (the absolute value of the slope of the indifference curve) is equal to the price ratio of the two goods.
- We can derive a demand curve from an indifference map by observing the quantity of the good consumed at different prices.
TRY IT !
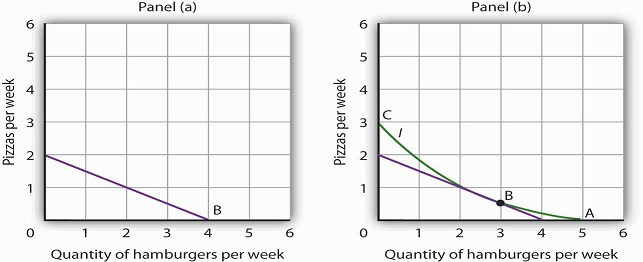
- Suppose a consumer has a budget for fast-food items of $20 per week and spends this money on two goods, hamburgers and pizzas. Suppose hamburgers cost $5 each and pizzas cost $10. Put the quantity of hamburgers purchased per week on the horizontal axis and the quantity of pizzas purchased per week on the vertical axis. Draw the budget line. What is its slope?
- Suppose the consumer in part (a) is indifferent among the combinations of hamburgers and pizzas shown. In the grid you used to draw the budget lines, draw an indifference curve passing through the combinations shown, and label the corresponding points A, B, and C. Label this curve I.
| Combination | Hamburgers/week | Pizzas/week |
|---|---|---|
| A | 5 | 0 |
| B | 3 |

|
| C | 0 | 3 |
- The budget line is tangent to indifference curve I at B. Explain the meaning of this tangency.
Case in Point: Preferences Prevail in P.O.W. Camps
© 2010 Jupiterimages Corporation
Economist R. A. Radford spent time in prisoner of war (P.O.W.) camps in Italy and Germany during World War II.He put this unpleasant experience to good use by testing a number of economic
theories there. Relevant to this chapter, he consistently observed utility-maximizing behavior.
In the P.O.W. camps where he stayed, prisoners received rations, provided by their captors and the Red Cross,including tinned milk, tinned beef, jam, butter, biscuits, chocolate, tea, coffee,
cigarettes, and other items.While all prisoners received approximately equal official rations (though some did manage to receive privatecare packages as well), their marginal rates of
substitution between goods in the ration packages varied. To increase utility, prisoners began to engage in trade.
Prices of goods tended to be quoted in terms of cigarettes. Some camps had better organized markets thanothers but, in general, even though prisoners of each nationality were housed
separately, so long as they could wander from bungalow to bungalow, the “cigarette” prices of goods were equal across bungalows. Trade allowed the prisoners to maximize their utility.
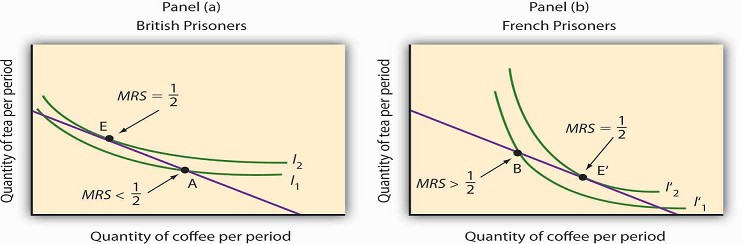
Consider coffee and tea. Panel (a) shows the indifference curves and budget line for typical British prisonersand Panel (b) shows the indifference curves and budget line for typical French
prisoners. Suppose the price of an ounce of tea is 2 cigarettes and the price of an ounce of coffee is 1 cigarette. The slopes of the budget lines in each panel are identical; all prisoners
faced the same prices. The price ratio is 1/2.
Suppose the ration packages given to all prisoners contained the same amounts of both coffee and tea. But notice that for typical British prisoners, given indifference curves which reflect
their general preference for tea,the MRS at the initial allocation (point A) is less than the price ratio. For French prisoners, the MRS is greater than the price ratio (point B). By trading,
both British and French prisoners can move to higher indifference curves. For the British prisoners, the utility-maximizing solution is at point E, with more tea and little coffee. For the
French prisoners the utility-maximizing solution is at point E′, with more coffee and less tea. In equilibrium,both British and French prisoners consumed tea and coffee so that their MRS’s
equal 1/2, the price ratio in the market.
Source: R. A. Radford, “The Economic Organisation of a P.O.W. Camp,” Economica 12 (November 1945): 189–201; and Jack Hirshleifer, Price Theory andApplications (Englewood Cliffs, NJ: Prentice
Hall, 1976): 85–86.
ANSWERS TO TRY IT! PROBLEM
- The budget line is shown in Panel (a). Its slope is − $5 / $10 = − 0.5 .
- Panel (b) shows indifference curve I. The points A, B, and C on I have been labeled.
- The tangency point at B shows the combinations of hamburgers and pizza that maximize the consumer’sutility, given the budget constraint. At the point of tangency, the marginal rate of substitution (MRS) between the two goods is equal to the ratio of prices of the two goods. This means that the rate at which the consumer is willing to exchange one good for another equals the rate at which the goods can be exchanged in the market.
- 3158 reads
