


A firm’s economic profit is the difference between total revenue and total cost. Recall that total cost is the opportunity cost of producing a certain good or service. When we speak of economic profit we are speaking of a firm’s total revenue less the total opportunity cost of its operations.
As we learned, a firm’s total cost curve in the short run intersects the vertical axis at some positive value equal to the firm’s total fixed costs. Total cost then rises at a decreasing rate over the range of increasing marginal returns to the firm’s variable factors.It rises at an increasing rate over the range of diminishing marginal returns. Figure 9.5 shows the total cost curve for Mr. Gortari, as well as the total revenue curve for a price of $0.40 per pound. Suppose that his total fixed cost is $400 per month. For any given level of output, Mr. Gortari’s economic profit is the vertical distance between the total revenue curve and the total cost curve at that level.
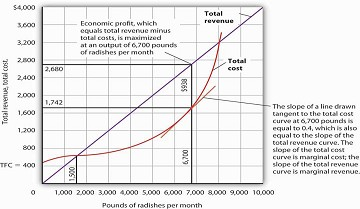
Economic profit is the vertical distance between the total revenue and total cost curves (revenue minus costs). Here, the maximum profit attainable by Tony Gortari for his radish production is $938 per month at an output of 6,700 pounds.
Let us examine the total revenue and total cost curves in Figure 9.5 more carefully. At zero units of output, Mr. Gortari’s total cost is $400 (his total fixed cost); total revenue is zero. Total cost continues to exceed total revenue up to an output of 1,500 pounds per month, at which point the two curves intersect. At this point, economic profit equals zero. As Mr. Gortari expands output above 1,500 pounds per month, total revenue becomes greater than total cost. We see that at a quantity of 1,500 pounds per month, the total revenue curve is steeper than the total cost curve. Because revenues are rising faster than costs, profits rise with increased output. As long as the total revenue curve is steeper than the total cost curve, profit increases as the firm increases its output.
The total revenue curve’s slope does not change as the firm increases its output. But the total cost curve becomes steeper and steeper as diminishing marginal returns set in. Eventually, the total cost and total revenue curves will have the same slope. That happens in Figure 9.5 at an output of 6,700 pounds of radishes per month. Notice that a line drawn tangent to the total cost curve at that quantity has the same slope as the total revenue curve.
As output increases beyond 6,700 pounds, the total cost curve continues to become steeper. It becomes steeper than the total revenue curve, and profits fall as costs rise faster than revenues. At an output slightly above 8,000 pounds per month, the total revenue and cost curves intersect again, and economic profit equals zero. Mr. Gortari achieves the greatest profit possible by producing 6,700 pounds of radishes per month, the quantity at which the total cost and total revenue curves have the same slope. More generally, we can conclude that a perfectly competitive firm maximizes economic profit at the output level at which the total revenue curve and the total cost curve have the same slope.
- 6720 reads
