


The slope of the total revenue curve is marginal revenue; the slope of the total cost curve is marginal cost. Economic profit, the difference between total revenue and total cost, is maximized where marginal revenue equals marginal cost. This is consistent with the marginal decision rule, which holds that a profit-maximizing firm should increase output until the marginal benefit of an additional unit equals the marginal cost. The marginal benefit of selling an additional unit is measured as marginal revenue. Finding the output at which marginal revenue equals marginal cost is thus an application of our marginal decision rule.
Figure 9.6 shows how a firm can use the marginal decision rule to determine its profit-maximizing output. Panel (a) shows the market for radishes; the market demand curve (D), and supply curve (S) that we had in Figure 9.2; the market price is $0.40 per pound. In Panel (b), the MR curve is given by a horizontal line at the market price. The firm’s marginal cost curve (MC) intersects the marginal revenue curve at the point where profit is maximized. Mr. Gortari maximizes profits by producing 6,700 pounds of radishes per month. That is, of course, the result we obtained in Figure 9.5, where we saw that the firm’s total revenue and total cost curves differ by the greatest amount at the point at which the slopes of the curves, which equal marginal revenue and marginal cost, respectively, are equal.
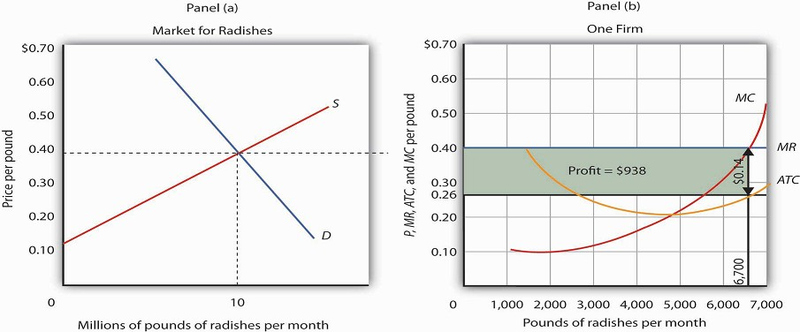
The market price is determined by the intersection of demand and supply. As always, the firm maximizes profit by applying the marginal decision rule. It takes the market price, $0.40 per pound, as given and selects an output at which MR equals MC. Economic profit per unit is the difference between ATC and price (here, $0.14 per pound);economic profit is profit per unit times the quantity produced ($0.14×6,700=$938).
We can use the graph in Figure 9.6 to compute Mr. Gortari’s economic profit. Economic profit per unit is the difference between price and average total cost. At the profit-maximizing output of 6,700 pounds of radishes per month, average total cost (ATC) is $0.26 per pound, as shown in Panel (b).Price is $0.40 per pound, so economic profit per unit is $0.14. Economic profit is found by multiplying economic profit per unit by the number of units produced; the firm’s economic profit is thus $938 ($0.14 × 6,700). It is shown graphically by the area of the shaded rectangle in Panel (b); this area equals the vertical distance between marginal revenue (MR) and average total cost (ATC) at an output of 6,700 pounds of radishes times the number of pounds of radishes produced, 6,700, in Figure 9.6.
Heads Up!
Look carefully at the rectangle that shows economic profit in Panel (b) of Figure 9.6. It is found by taking the profit-maximizing quantity, 6,700 pounds, then reading up to the ATC curve and the firm’s demand curve at the market price. Economic profit per unit equals price minus average total cost (P − ATC).
The firm’s economic profit equals economic profit per unit times the quantity produced. It is found by extending horizontal lines from the ATC and MR curve to the vertical axis and taking the area of the rectangle formed.
There is no reason for the profit-maximizing quantity to correspond to the lowest point on the ATC curve; it does not in this case. Students sometimes make the mistake of calculating economic profit as the difference between the price and the lowest point on the ATC curve. That gives us the maximum economic profit per unit, but we assume that firms maximize economic profit, not economic profit per unit. The firm’s economic profit equals economic profit per unit times quantity. The quantity that maximizes economic profit is determined by the intersection of ATC and MR.
- 3384 reads
