


The long-run aggregate supply (LRAS) curve relates the level of output produced by firms to the price level in the long run. In Panel (b) of Figure 22.4, the long-run aggregate supply curve is a vertical line at the economy’s potential level of output. There is a single real wage at which employment reaches its natural level. In Panel (a) of Figure 22.4, only a real wage of ωe generates natural employment Le.The economy could, however, achieve this real wage with any of an infinitely large set of nominal wage and price-level combinations. Suppose, for example, that the equilibrium real wage (the ratio of wages to the price level) is 1.5. We could have that with a nominal wage level of 1.5 and a price level of 1.0, a nominal wage level of 1.65 and a price level of 1.1, a nominal wage level of 3.0 and a price level of 2.0,and so on.
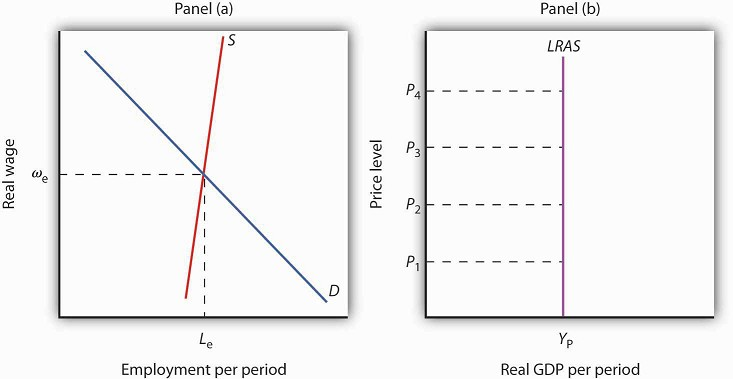
When the economy achieves its natural level of employment, as shown in Panel (a) at the intersection of the demand and supply curves for labor, it achieves its potential output, as shown in Panel (b) by the vertical long-run aggregate supply curve LRAS at YP.
In Panel (b) we see price levels ranging from P1 to P4. Higher price levels would require higher nominal wages to create a real wage of ωe, and flexible nominal wages would achieve that in the long run.
In the long run, then, the economy can achieve its natural level of employment and potential output at any price level. This conclusion gives us our long-run aggregate supply curve. With only one level of output at any price level, the long-run aggregate supply curve is a vertical line at the economy’s potential level of output of YP.
- 2935 reads
