


The intersection of the economy’s aggregate demand curve and the long-run aggregate supply curve determines its equilibrium real GDP and price level in the long run. Figure 22.5 depicts an economy in long-run equilibrium. With aggregate demand at AD1 and the long-run aggregate supply curve as shown, real GDP is $12,000 billion per year and the price level is 1.14. If aggregate demand increases to AD2, long-run equilibrium will be reestablished at real GDP of $12,000 billion per year, but at a higher price level of 1.18. If aggregate demand decreases to AD3, long-run equilibrium will still be at real GDP of $12,000 billion per year, but with the now lower price level of 1.10.
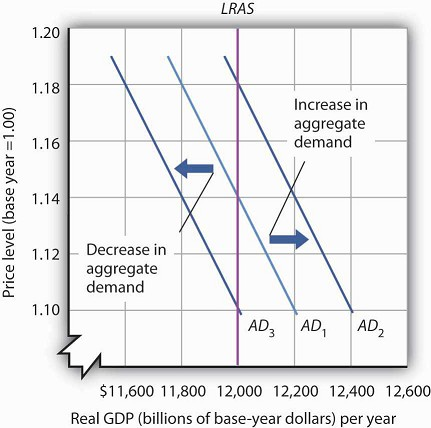
Long-run equilibrium occurs at the intersection of the aggregate demand curve and the long-run aggregate supply curve. For the three aggregate demand curves shown, long-run equilibrium occurs at three different price levels, but always at an output level of $12,000 billion per year, which corresponds to potential output.
- 2784 reads
