


As workers and firms become aware that the general price level is rising, they will incorporate this fact into their expectations of future prices. In reaching new agreements on wages, they are likely to settle on higher nominal wages. Firms with sticky prices will adjust their prices upward as they anticipate higher prices throughout the economy.
As we saw in the chapter introducing the model of aggregate demand and aggregate supply, increases in nominal wages and in prices that were sticky will shift the short-run aggregate supply curve to the left. Such a shift is illustrated in Panel (a) of Figure 31.7, where SRAS1,2,3 shifts to SRAS4. The result is a shift to point 4; the price level rises to 1.075, and real GDP falls to $970 billion. The increase in the price level to 1.075 from 1.045 implies an inflation rate of 2.9% ([1.075 − 1.045] / 1.045 = 2.9%); unemployment rises to 6.0% with the decrease in real GDP. The new combination of inflation and unemployment is given by point 4 in Panel (b).
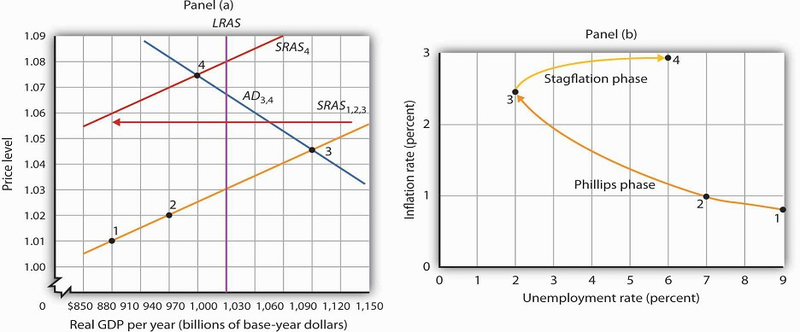
In the stagflation phase, workers and firms adjust their expectations in a higher price level. As they act on their expectations, the short-run aggregate supply curve shifts leftward in Panel (a). The price level rises to 1.075, and real GDP falls to $970 billion. The inflation rate rises to 2.9% as unemployment rises to 6.0% at point 4 in Panel (b).
The essential feature of the stagflation phase is a change in expectations. Workers and firms that were blindsided by rising prices during the Phillips phase ended up with lower real wages and lower relative price levels than they intended. In the stagflation phase, they catch up. But the catching up shifts the short-run aggregate supply curve to the left, producing a reduction in real GDP and an increase in the price level.
- 3158 reads
