


Problem 4.1: Simple Fourier Series
Find the complex Fourier series representations of the following signals without explicitly calculating Fourier integrals. What is the signal's period in each case?
- s (t) = sin(t)
- s (t) = sin2 (t)
- s (t) = cos(t) + 2cos (2t)
- s (t) = cos (2t) cos (t)
-
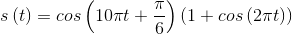
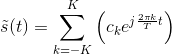
- s (t) given by the depicted waveform (Figure 4.18)

Problem 4.2: Fourier Series
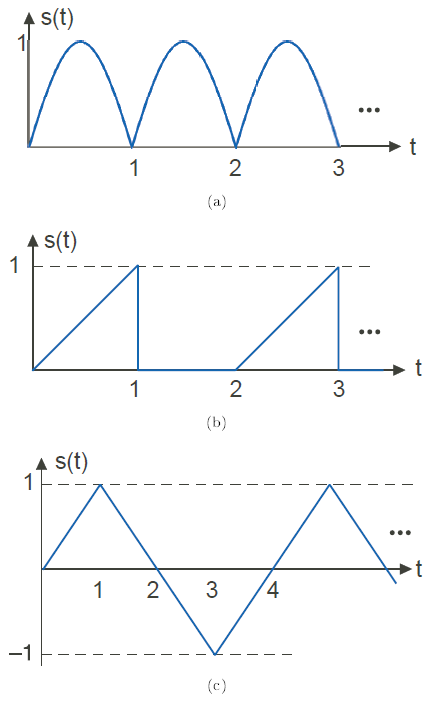
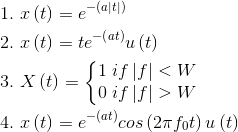
Find the Fourier series representation for the following periodic signals (Figure 4.19). For the third signal, find the complex Fourier series for the triangle wave without performing the usual Fourier integrals.
Hint:
How is this signal related to one for which you already have the series?
Problem 4.3: Phase Distortion
We can learn about phase distortion by returning to circuits and investigate the following circuit (Figure 4.20).
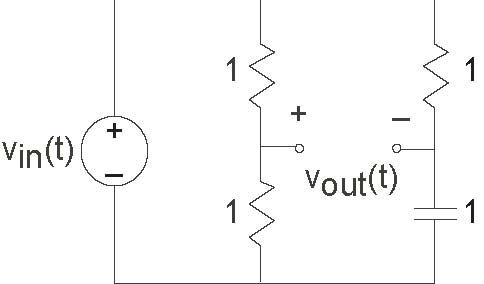
- Find this filter’s transfer function.
- Find the magnitude and phase of this transfer function. How would you characterize this circuit?
- Let vin (t) be a square-wave of period T. What is the Fourier series for the output voltage?
- Use Matlab to find the output's waveform for the cases T =0.01 and T =2. What value of T delineates the two kinds of results you found? The software in fourier2.m might be useful.
- Instead of the depicted circuit, the square wave is passed through a system that delays its input, which applies a linear phase shift to the signal's spectrum. Let the delay τ be
 . Use the transfer function of a delay to compute using Matlab the
Fourier series of the output. Show that the square wave is indeed delayed.
. Use the transfer function of a delay to compute using Matlab the
Fourier series of the output. Show that the square wave is indeed delayed.
Problem 4.4: Approximating Periodic Signals
Often, we want to approximate a reference signal by a somewhat simpler signal. To assess the quality of an approximation, the most frequently used error measure is the mean-squared error. For
a periodic signal s (t),
where s (t) is the reference signal and  its approximation. One convenient way of finding approximations for periodic signals is to truncate their Fourier series.
The point of this problem is to analyze whether this approach is the best (i.e., always minimizes the mean-squared error).
- Find a frequency-domain expression for the approximation error when we use the truncated Fourier series as the approximation.
- Instead of truncating the series, let's generalize the nature of the approximation to including any set of 2K +1 terms: We'll always include the c0 and the negative indexed term corresponding to ck. What selection of terms minimizes the mean-squared error? Find an expression for the mean-squared error resulting from your choice.
- Find the Fourier series for the depicted signal (Figure 4.21). Use Matlab to find the truncated approximation and best approximation involving two terms. Plot the mean-squared error as a function of K for both approximations.
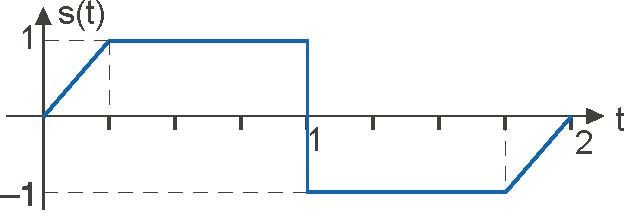
Problem 4.5: Long, Hot Days
The daily temperature is a consequence of several effects, one of them being the sun's heating. If this were the dominant effect, then daily temperatures would be proportional to the number
of daylight hours. The plot (Figure 4.22) shows that the
average daily high temperature does not behave that way.
In this problem, we want to understand the temperature component of our environment using Fourier series and linear system theory. The file temperature.mat contains these data (daylight hours in the first row, corresponding average daily highs in the second) for Houston, Texas.
- Let the length of day serve as the sole input to a system having an output equal to the average daily temperature. Examining the plots of input and output, would you say that the system is linear or not? How did you reach you conclusion?
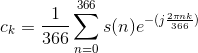
- Find the first five terms (c0, ... , c4) of the complex Fourier series for each signal. Use the following formula that approximates the integral required to find the
Fourier coefficients.
- What is the harmonic distortion in the two signals? Exclude c0 from this calculation.
- Because the harmonic distortion is small, let's concentrate only on the first harmonic. What is the phase shift between input and output signals?
- Find the transfer function of the simplest possible linear model that would describe the data. Characterize and interpret the structure of this model. In particular, give a physical explanation for the phase shift.
- Predict what the output would be if the model had no phase shift. Would days be hotter? If so, by how much?
Problem 4.6: Fourier Transform Pairs
Find the Fourier or inverse Fourier transform of the following.
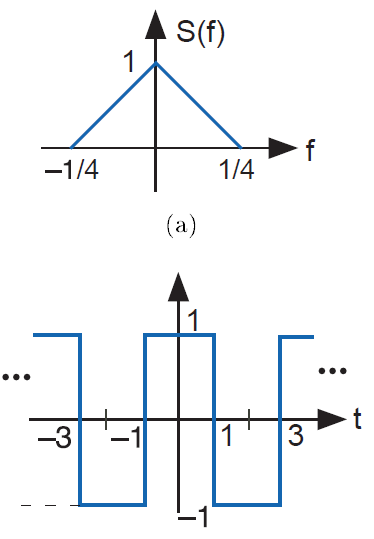
Problem 4.7: Duality in Fourier Transforms
"Duality" means that the Fourier transform and the inverse Fourier transform are very similar. Consequently, the waveform s (t) in the time domain and the spectrum s (f) have a Fourier transform and an inverse Fourier transform, respectively, that are very similar.
- Calculate the Fourier transform of the signal shown below (Figure 4.23(a)).
- Calculate the inverse Fourier transform of the spectrum shown below (Figure 4.23(b)).
- How are these answers related? What is the general relationship between the Fourier transform of s (t) and the inverse transform of s (f)?
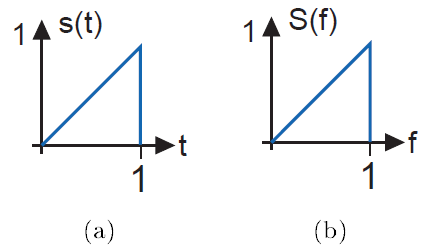
Problem 4.8: Spectra of Pulse Sequences
Pulse sequences occur often in digital communication and in other fields as well. What are their spectral properties?
- Calculate the Fourier transform of the single pulse shown below (Figure 4.24(a)).
- Calculate the Fourier transform of the two-pulse sequence shown below (Figure 4.24(b)).
- Calculate the Fourier transform for the ten-pulse sequence shown in below (Figure 4.24(c)). You should look for a general expression that holds for sequences of any length.
- Using Matlab, plot the magnitudes of the three spectra. Describe how the spectra change as the number of repeated pulses increases.
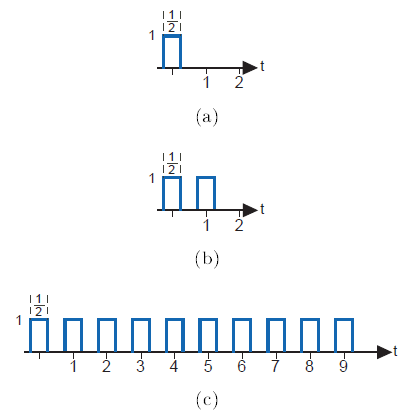
One way to represent bits with signals is shown in Figure 4.25. If the value of a bit is a "1", it is represented by a positive pulse of duration T. If it is a "0", it is
represented by a negative pulse of the same duration. To represent a sequence of bits, the appropriately chosen pulses are placed one after the other.
- What is the spectrum of the waveform that represents the alternating bit sequence "...01010101..."?
- This signal's bandwidth is defined to be the frequency range over which 90% of the power is contained. What is this signal's bandwidth?
- Suppose the bit sequence becomes "...00110011..." Now what is the bandwidth?
Problem 4.10: Lowpass Filtering a Square Wave
Let a square wave (period T ) serve as the input to a first-order lowpass system constructed as a RC filter. We want to derive an expression for the time-domain response of the filter to this input.
- First, consider the response of the filter to a simple pulse, having unit amplitude and width
 . Derive an expression for the filter's output to this pulse.
- Noting that the square wave is a superposition of a sequence of these pulses, what is the filter's response to the square wave?
- The nature of this response should change as the relation between the square wave's period and the filter's cutoff frequency change. How long must the period be so that the response does not achieve a relatively constant value between transitions in the square wave? What is the relation of the filter's cutoff frequency to the square wave's spectrum in this case?
Problem 4.11: Mathematics with Circuits
Simple circuits can implement simple mathematical operations, such as integration and differentiation. We want to develop an active circuit (it contains an op-amp) having an output that is proportional to the integral of its input. For example, you could use an integrator in a car to determine distance traveled from the speedometer.
- What is the transfer function of an integrator?
- Find an op-amp circuit so that its voltage output is proportional to the integral of its input for all signals.
Problem 4.12: Where is that sound coming from?
We determine where sound is coming from because we have two ears and a brain. Sound travels at a relatively slow speed and our brain uses the fact that sound will arrive at one ear before the
other. As shown here (Figure 4.26), a sound
coming from the right arrives at the left ear τ seconds after it arrives at the right ear.
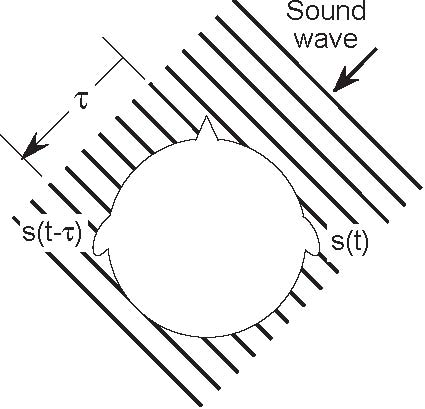
Once the brain fnds this propagation delay, it can determine the sound direction. In an attempt to model what the brain might do, RU signal processors want to design an optimal system that delays each ear's signal by some amount then adds them together. Δl and Δr are the delays applied to the left and right signals respectively. The idea is to determine the delay values according to some criterion that is based on what is measured by the two ears.
- What is the transfer function between the sound signal s (t) and the processor output y (t)?
- One way of determining the delay τ is to choose Δl and Δr to maximize the power in y (t). How are these maximum-power processing delays related to τ?
Problem 4.13: Arrangements of Systems
Architecting a system of modular components means arranging them in various confgurations to achieve some overall input-output relation. For each of the following (Figure 4.27), determine the overall transfer function between x
(t) and y (t).
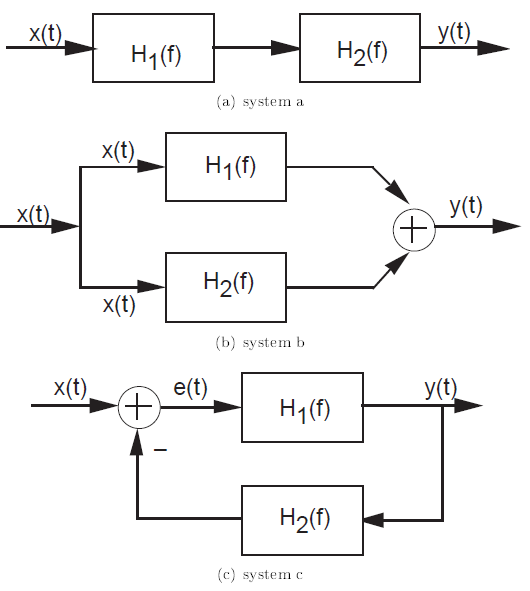
The overall transfer function for the cascade (first depicted system) is particularly interesting. What does it say about the effect of the ordering of linear, time-invariant systems in a cascade?
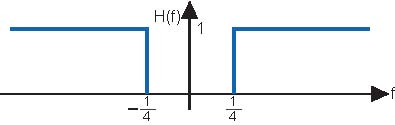
Problem 4.14: Filtering
Let the signal s (t)= sin(πt πt) be the input to a linear, time-invariant filter having the transfer function shown below
(Figure 4.28). Find the expression for y (t), the filter's
output.
Problem 4.15: Circuits Filter!
A unit-amplitude pulse with duration of one second serves as the input to an RC-circuit having transfer function
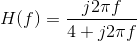
- How would you categorize this transfer function: lowpass, highpass, bandpass, other?
- Find a circuit that corresponds to this transfer function.
- Find an expression for the filter's output.
Problem 4.16: Reverberation
Reverberation corresponds to adding to a signal its delayed version.
- Assuming τ represents the delay, what is the input-output relation for a reverberation system? Is the system linear and time-invariant? If so, find the transfer function; if not, what linearity or time invariance criterion does reverberation violate.
- A music group known as the ROwls is having trouble selling its recordings. The record company's engineer gets the idea of applying different delay to the low and high frequencies and adding the result to create a new musical effect. Thus, the ROwls' audio would be separated into two parts (one less than the frequency f0, the other greater than f0), these would be delayed by τl and τh respectively, and the resulting signals added. Draw a block diagram for this new audio processing system, showing its various components.
- How does the magnitude of the system's transfer function depend on the two delays?
Problem 4.17: Echoes in Telephone Systems
A frequently encountered problem in telephones is echo. Here, because of acoustic coupling between the ear piece and microphone in the handset, what you hear is also sent to the person talking. That person thus not only hears you, but also hears her own speech delayed (because of propagation delay over the telephone network) and attenuated (the acoustic coupling gain is less than one). Furthermore, the same problem applies to you as well: The acoustic coupling occurs in her handset as well as yours.
- Develop a block diagram that describes this situation.
- Find the transfer function between your voice and what the listener hears.
- Each telephone contains a system for reducing echoes using electrical means. What simple system could null the echoes?
Problem 4.18: Effective Drug Delivery
In most patients, it takes time for the concentration of an administered drug to achieve a constant level in the blood stream. Typically, if the drug concentration in the patient's intravenous line is Cdu (t), the concentration in the patient's blood stream is Cp( 1 − e−(at))u (t).
- Assuming the relationship between drug concentration in the patient's drug and the delivered concentration can be described as a linear, time-invariant system, what is the transfer function?
- Sometimes, the drug delivery system goes awry and delivers drugs with little control. What would the patient's drug concentration be if the delivered concentration were a ramp? More precisely, if it were Cdtu (t)?
- A clever doctor wants to have the flexibility to slow down or speed up the patient's drug concentration. In other words, the concentration is to be Cp( 1 − e−(bt))u (t), with b bigger or smaller than a. How should the delivered drug concentration signal be changed to achieve this concentration profile?
Problem 4.19: Catching Speeders with Radar
RU Electronics has been contracted to design a Doppler radar system. Radar transmitters emit a signal that bounces of any conducting object. Signal diferences between what is sent and the radar return is processed and features of interest extracted. In Doppler systems, the object's speed along the direction of the radar beam is the feature the design must extract. The transmitted signal is a sinsusoid: x (t)= Acos (2πfct). The measured return signal equals Bcos (2π ((fc + Δf) t + ϕ)), where the Doppler offset frequency Δf equals 10v, where v is the car's velocity coming toward the transmitter.
- Design a system that uses the transmitted and return signals as inputs and produces Δf.
- One problem with designs based on overly simplistic design goals is that they are sensitive to unmodeled assumptions. How would you change your design, if at all, so that whether the car is going away or toward the transmitter could be determined?
- Suppose two objects traveling different speeds provide returns. How would you change your design, if at all, to accomodate multiple returns?
Problem 4.20: Demodulating an AM Signal
Let m (t) denote the signal that has been amplitude modulated.

Radio stations try to restrict the amplitude of the signal m (t) so that it is less than one in magnitude. The frequency fcis very large compared to the frequency content of the signal. What we are concerned about here is not transmission, but
reception.
- The so-called coherent demodulator simply multiplies the signal x (t) by a sinusoid having the same frequency as the carrier and lowpass filters the result. Analyze this receiver and show that it works. Assume the lowpass filter is ideal.
- One issue in coherent reception is the phase of the sinusoid used by the receiver relative to that used by the transmitter. Assuming that the sinusoid of the receiver has a phase φ, how does the output depend on φ? What is the worst possible value for this phase?
- The incoherent receiver is more commonly used because of the phase sensitivity problem inherent in coherent reception. Here, the receiver full-wave rectifes the received signal and lowpass filters the result (again ideally). Analyze this receiver. Does its output difer from that of the coherent receiver in a signifcant way?
Problem 4.21: Unusual Amplitude Modulation
We want to send a band-limited signal having the depicted spectrum (Figure 4.29(a)) with amplitude modulation in the usual way. I.B. Different suggests using the square-wave carrier shown below (Figure 4.29(b)). Well, it is different, but his friends wonder if any technique can demodulate it.
- Find an expression for X (f), the Fourier transform of the modulated signal.
- Sketch the magnitude of X (f), being careful to label important magnitudes and frequencies.
- What demodulation technique obviously works?
- I.B. challenges three of his friends to demodulate x (t) some other way. One friend suggests modulating x (t)
with
 , another wants to try modulating with
  and the third thinks cos 2 will work. Sketch the magnitude of the
Fourier transform of the signal each student's approach produces. Which student comes closest to recovering the original signal? Why?
and the third thinks cos 2 will work. Sketch the magnitude of the
Fourier transform of the signal each student's approach produces. Which student comes closest to recovering the original signal? Why?
Problem 4.22: Sammy Falls Asleep...
While sitting in ELEC 241 class, he falls asleep during a critical time when an AM receiver is being described. The received signal has the form r (t)= A(1 + m (t)) cos (2πfct + φ) where the phase φ is
unknown. The message signal is m (t); it has a bandwidth of W Hz and a magnitude less than 1 (|m (t) | < 1). The phase φ is unknown. The instructor drew a
diagram (Figure 4.30) for a receiver on the board;
Sammy slept through the description of what the unknown systems where.
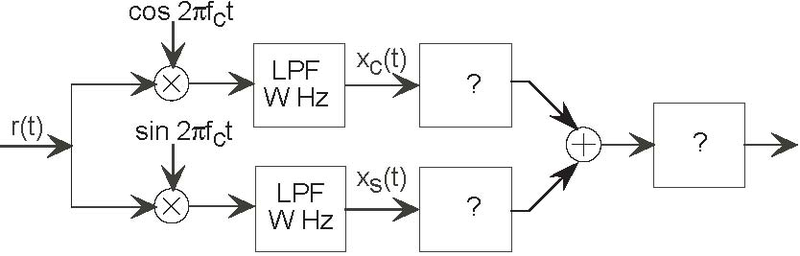
- What are the signals xc(t) and xs (t)?
- What would you put in for the unknown systems that would guarantee that the final output contained the message regardless of the phase? HINT: Think of a trigonometric identity that would prove useful.
- Sammy may have been asleep, but he can think of a far simpler receiver. What is it?
Problem 4.23: Jamming
Sid Richardson college decides to set up its own AM radio station KSRR. The resident electrical engineer decides that she can choose any carrier frequency and
message bandwidth for the station. A rival college decides to jam its transmissions by transmitting a high-power signal that interferes with radios that try to
receive KSRR. The jamming signal jam (t) is what is known as a sawtooth wave (depicted in Figure 4.31) having a period known to KSRR's engineer.
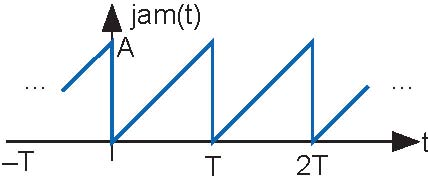
Find the spectrum of the jamming signal.
Can KSRR entirely circumvent the attempt to jam it by carefully choosing its carrier frequency and transmission bandwidth? If so, find the station's carrier frequency and transmission
bandwidth in terms of T , the period of the jamming signal; if not, show why not.
Problem 4.24: AM Stereo
A stereophonic signal consists of a "left" signal l (t) and a "right" signal r (t) that conveys sounds coming from an orchestra's left and right sides, respectively. To transmit these two
signals simultaneously, the transmitter first forms the sum signal s+ (t)= l (t)+ r (t) and the difference signal s− (t)= l (t) − r (t). Then, the transmitter amplitude-modulates the
difference signal with a sinusoid having frequency 2W , where W is the bandwidth of the left and right signals. The sum signal and
the modulated difference signal are added, the sum amplitude-modulated to the radio station's carrier frequency fc, and transmitted. Assume the spectra of the left and right signals are as
shown (Figure 4.32).
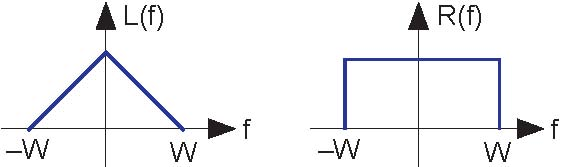
- What is the expression for the transmitted signal? Sketch its spectrum.
- Show the block diagram of a stereo AM receiver that can yield the left and right signals as separate outputs.
- What signal would be produced by a conventional coherent AM receiver that expects to receive a standard AM signal conveying a message signal having bandwidth W ?
Problem 4.25: Novel AM Stereo Method
A clever engineer has submitted a patent for a new method for transmitting two signals simultaneously in the same transmission bandwidth as commercial AM radio.
As shown (Figure 4.33), her approach is to
modulate the positive portion of the carrier with one signal and the negative portion with a second.
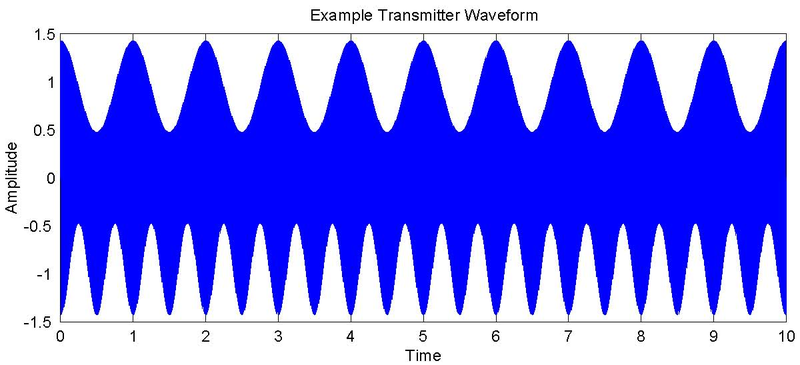
In detail the two message signals m1 (t) and m2 (t) are bandlimited to W Hz and have maximal amplitudes equal to 1. The carrier has a frequency fc much greater than W . The transmitted signal x (t) is given by
In all cases, 0 <a< 1. The plot shows the transmitted signal when the messages are sinusoids: m1 (t)= sin (2πfmt) and m2 (t) = sin (2π2fmt) where 2fm <W . You, as the patent
examiner, must determine whether the scheme meets its claims and is useful.
Problem 4.26: A Radical Radio Idea
An ELEC 241 student has the bright idea of using a square wave instead of a sinusoid as an AM carrier. The transmitted signal would have the form

where the message signal m (t) would be amplitude-limited: |m (t) | < 1
- Assuming the message signal is lowpass and has a bandwidth of W Hz, what values for the square wave's period T are feasible. In other words, do some combinations of W and T prevent reception?
- Assuming reception is possible, can standard radios receive this innovative AM transmission? If so, show how a coherent receiver could demodulate it; if not, show how the coherent receiver's output would be corrupted. Assume that the message bandwidth W =5 kHz.
Problem 4.27: Secret Communication
An amplitude-modulated secret message m (t) has the following form.

The message signal has a bandwidth of W Hz and a magnitude less than 1 (|m (t) | < 1). The idea is to offset the carrier frequency by f0 Hz from standard radio carrier frequencies. Thus, "of-the-shelf" coherent demodulators would assume the carrier frequency has fc Hz. Here,
f0 <W .
- Sketch the spectrum of the demodulated signal produced by a coherent demodulator tuned to fc Hz.
- Will this demodulated signal be a "scrambled" version of the original? If so, how so; if not, why not?
- Can you develop a receiver that can demodulate the message without knowing the offset frequency fc?
Problem 4.28: Signal Scrambling
An excited inventor announces the discovery of a way of using analog technology to render music unlistenable without knowing the secret recovery method. The idea is to modulate the
bandlimited message m (t) by a special periodic signal s (t) that is zero during half of its period, which
renders the message unlistenable and superficially, at least, unrecoverable (Figure 4.34).
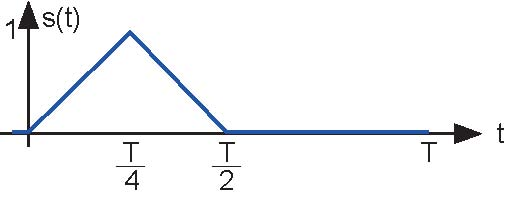
- What is the Fourier series for the periodic signal?
- What are the restrictions on the period T so that the message signal can be recovered from m (t) s (t)?
- ELEC 241 students think they have "broken" the inventor's scheme and are going to announce it to the world. How would they recover the original message without having detailed knowledge of the modulating signal?
- 8306 reads
