


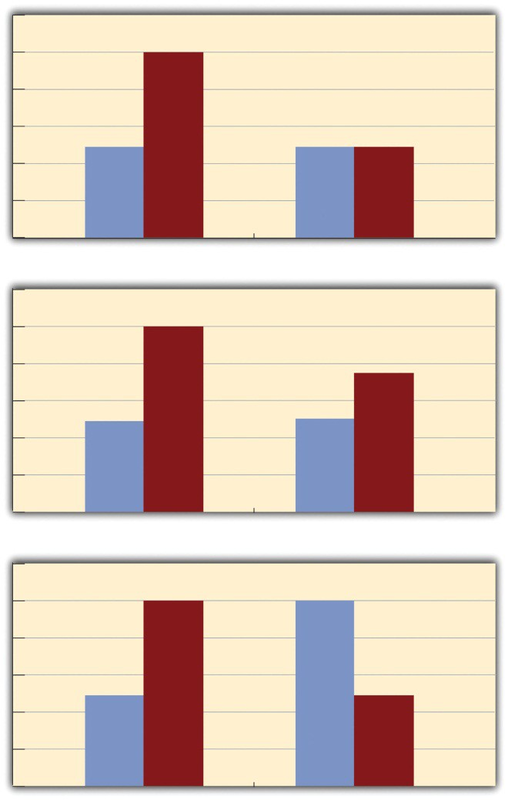
In factorial designs, there are two kinds of results that are of interest: main effects and interaction effects (which are also called just “interactions”). A main effect is the statistical relationship between one independent variable and a dependent variable—averaging across the levels of the other independent variable. Thus there is one main effect to consider for each independent variable in the study. The top panel of Figure 8.3 shows a main effect of cell phone use because driving performance was better, on average, when participants were not using cell phones than when they were. The blue bars are, on average, higher than the red bars. It also shows a main effect of time of day because driving performance was better during the day than during the night—both when participants were using cell phones and when they were not. Main effects are independent of each other in the sense that whether or not there is a main effect of one independent variable says nothing about whether or not there is a main effect of the other. The bottom panel of Figure 8.3, for example, shows a clear main effect of psychotherapy length. The longer the psychotherapy, the better it worked. But it also shows no overall advantage of one type of psychotherapy over the other.
There is an interaction effect (or just “interaction”) when the effect of one independent variable depends on the level of another. Although this might seem complicated, you have an intuitive understanding of interactions already. It probably would not surprise you, for example, to hear that the effect of receiving psychotherapy is stronger among people who are highly motivated to change than among people who are not motivated to change. This is an interaction because the effect of one independent variable (whether or not one receives psychotherapy) depends on the level of another (motivation to change). Schnall and her colleagues also demonstrated an interaction because the effect of whether the room was clean or messy on participants’ moral judgments depended on whether the participants were low or high in private body consciousness. If they were high in private body consciousness, then those in the messy room made harsher judgments. If they were low in private body consciousness, then whether the room was clean or messy did not matter.
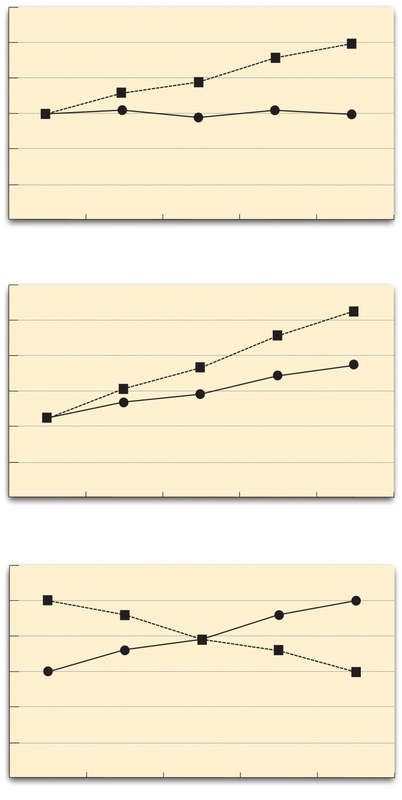
The effect of one independent variable can depend on the level of the other in different ways. This is shown in Figure 8.4. In the top panel, one independent variable has an effect at one level of the second independent variable but no effect at the others. (This is much like the study of Schnall and her colleagues where there was an effect of disgust for those high in private body consciousness but not for those low in private body consciousness.) In the middle panel, one independent variable has a stronger effect at one level of the second independent variable than at the other level. This is like the hypothetical driving example where there was a stronger effect of using a cell phone at night than during the day. In the bottom panel, one independent variable again has an effect at both levels of the second independent variable, but the effects are in opposite directions. Figure 8.4 shows the strongest form of this kind of interaction, called a crossover interaction. One example of a crossover interaction comes from a study by Kathy Gilliland on the effect of caffeine on the verbal test scores of introverts and extroverts (Gilliland, 1980). 1 Introverts perform better than extroverts when they have not ingested any caffeine. But extroverts perform better than introverts when they have ingested 4 mg of caffeine per kilogram of body weight. Figure 8.5 shows examples of these same kinds of interactions when one of the independent variables is quantitative and the results are plotted in a line graph. Note that in a crossover interaction, the two lines literally “cross over” each other.
In many studies, the primary research question is about an interaction. The study by Brown and her colleagues was inspired by the idea that people with hypochondriasis are especially attentive to any negative health-related information. This led to the hypothesis that people high in hypochondriasis would recall negative health-related words more accurately than people low in hypochondriasis but recall non- health-related words about the same as people low in hypochondriasis. And of course this is exactly what happened in this study.
KEY TAKEAWAYS
- Researchers often include multiple independent variables in their experiments. The most common approach is the factorial design, in which each level of one independent variable is combined with each level of the others to create all possible conditions.
- In a factorial design, the main effect of an independent variable is its overall effect averaged across all other independent variables. There is one main effect for each independent variable.
- There is an interaction between two independent variables when the effect of one depends on the level of the other. Some of the most interesting research questions and results in psychology are specifically about interactions.
EXERCISES
- Practice: Return to the five article titles presented at the beginning of this section. For each one, identify the independent variables and the dependent variable.
- Practice: Create a factorial design table for an experiment on the effects of room temperature and noise level on performance on the SAT. Be sure to indicate whether each independent variable will be manipulated between subjects or within subjects and explain why.
- 10118 reads
