


Like graphs, tables can be used to present large amounts of information clearly and efficiently. The same general principles apply to tables as apply to graphs. They should add important information to the presentation of your results, be as simple as possible, and be interpretable on their own. Again, we focus here on tables for an APA-style manuscript.
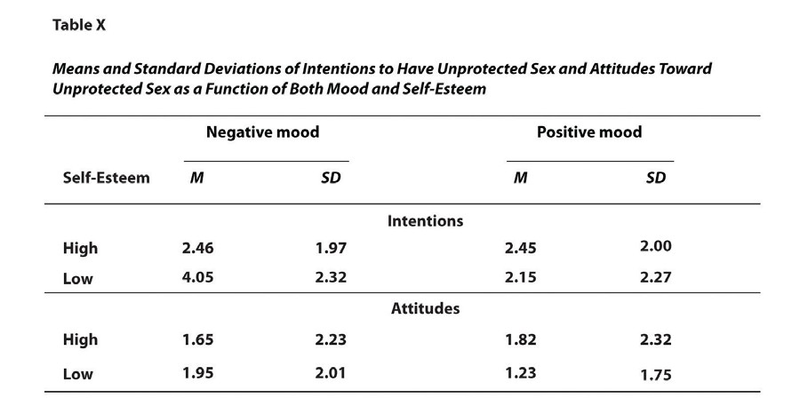
The most common use of tables is to present several means and standard deviations—usually for complex research designs with multiple independent and dependent variables. Figure 12.14, for example, shows the results of a hypothetical study similar to the one by MacDonald and Martineau (2002) 1 discussed in Psychological Measurement. (The means in Figure 12.14 are the means reported by MacDonald and Martineau, but the standard errors are not). Recall that these researchers categorized participants as having low or high self-esteem, put them into a negative or positive mood, and measured their intentions to have unprotected sex. Although not mentioned in Psychological Measurement, they also measured participants’ attitudes toward unprotected sex. Notice that the table includes horizontal lines spanning the entire table at the top and bottom, and just beneath the column headings. Furthermore, every column has a heading—including the leftmost column—and there are additional headings that span two or more columns that help to organize the information and present it more efficiently. Finally, notice that APA-style tables are numbered consecutively starting at 1 (Table 1, Table 2, and so on) and given a brief but clear and descriptive title.
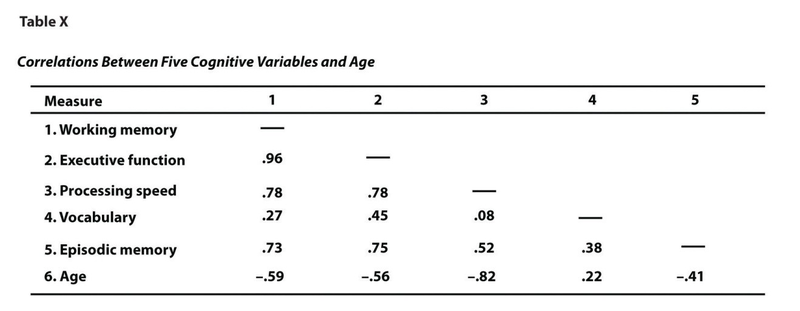
Another common use of tables is to present correlations—usually measured by Pearson’s r—among several variables. This is called a correlation matrix. Figure 12.15 is a correlation matrix based on a study by David McCabe and colleagues (McCabe, Roediger, McDaniel, Balota, & Hambrick, 2010). 2 They were interested in the relationships between working memory and several other variables. We can see from the table that the correlation between working memory and executive function, for example, was an extremely strong .96, that the correlation between working memory and vocabulary was a medium .27, and that all the measures except vocabulary tend to decline with age. Notice here that only half the table is filled in because the other half would have identical values. For example, the Pearson’s rvalue in the upper right corner (working memory and age) would be the same as the one in the lower left corner (age and working memory). The correlation of a variable with itself is always 1.00, so these values are replaced by dashes to make the table easier to read.
As with graphs, precise statistical results that appear in a table do not need to be repeated in the text. Instead, the writer can note major trends and alert the reader to details (e.g., specific correlations) that are of particular interest.
KEY TAKEAWAYS
- In an APA-style article, simple results are most efficiently presented in the text, while more complex results are most efficiently presented in graphs or tables.
- APA style includes several rules for presenting numerical results in the text. These include using words only for numbers less than 10 that do not represent precise statistical results, and rounding results to two decimal places, using words (e.g., “mean”) in the text and symbols (e.g., “M”) in parentheses.
- APA style includes several rules for presenting results in graphs and tables. Graphs and tables should add information rather than repeating information, be as simple as possible, and be interpretable on their own with a descriptive caption (for graphs) or a descriptive title (for tables).
EXERCISE
- Practice: In a classic study, men and women rated the importance of physical attractiveness in both a short-term mate and a long-term mate (Buss & Schmitt, 1993). 3The means and standard deviations are as follows. Men / Short Term: M= 5.67, SD= 2.34; Men / Long Term: M= 4.43, SD= 2.11; Women / Short Term: M= 5.67, SD= 2.48; Women / Long Term: M= 4.22, SD= 1.98. Present these results (a) in writing, (b) in a graph, and (c) in a table.
- 14332 reads
