


As we have seen throughout this book, bar graphs are generally used to present and compare the
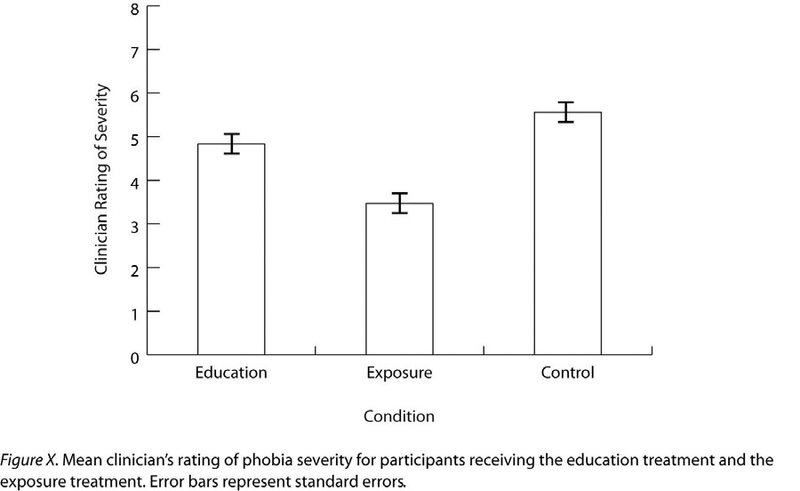
mean scores for two or more groups or conditions. The bar graph in Figure 12.11 is an APA-style version of Figure 12.5. Notice that it conforms to all the guidelines listed. A new element
in Figure 12.11 is
the smaller vertical bars that extend both upward and downward from the top of each main bar. These are error bars, and they
represent the variability in each group or condition.
Although they sometimes extend one standard deviation in each
direction, they are more likely to extend one standard error in each direction (as in Figure 12.11).
The standard error is the standard deviation of the group divided by the square root of the sample size of the group. The standard error is used because, in general, a difference between group means that is greater than two standard errors is statistically significant. Thus one can “see” whether a difference is statistically significant based on a bar graph with error bars.
- 2855 reads
