


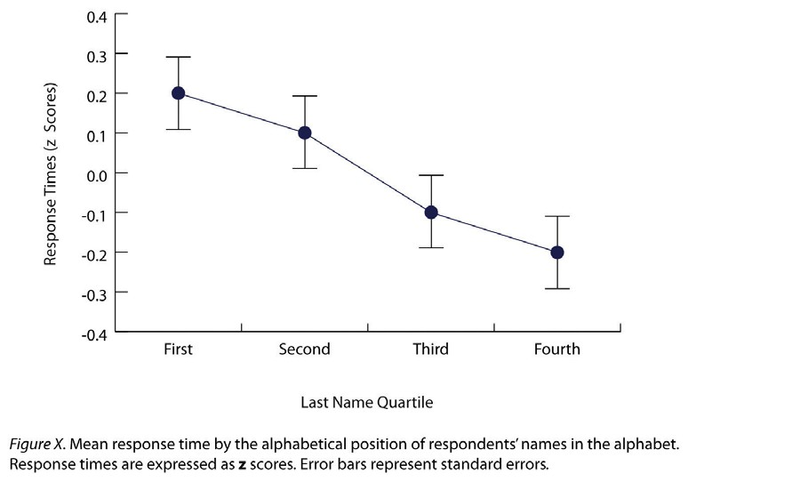
Line graphs are used to present correlations between quantitative variables when the independent variable has, or is organized into, a relatively small number of distinct levels. Each point in a line graph represents the mean score on the dependent variable for participants at one level of the independent variable. Figure 12.12 is an APA-style version of the results of Carlson and Conard. Notice that it includes error bars representing the standard error and conforms to all the stated guidelines.
In most cases, the information in a line graph could just as easily be presented in a bar graph. In Figure 12.12, for example, one could replace each point with a bar that reaches up to the same level and leave the error bars right where they are. This emphasizes the fundamental similarity of the two types of statistical relationship. Both are differences in the average score on one variable across levels of another. The convention followed by most researchers, however, is to use a bar graph when the variable plotted on the x-axis is categorical and a line graph when it is quantitative.
- 2717 reads
