


We now consider how to represent a consumer’s tastes in two dimensions, given that he can order, or rank, different consumption bundles, and that he can define a series of different bundles that all yield the same satisfaction. We limit ourselves initially to considering just “goods,” and not “bads” such as pollution.
Figure 6.7 examines the implications of these assumptions about tastes. Each point shows a consumption bundle of snowboarding and jazz. Let us begin at bundle R. Since more of a good is preferred to less, any point such as L, which lies to the northeast of R, is preferred to R, since L offers more of both goods than R. Conversely, points to the southwest of R offer less of each good than R, and therefore R is preferred to a point such as V.
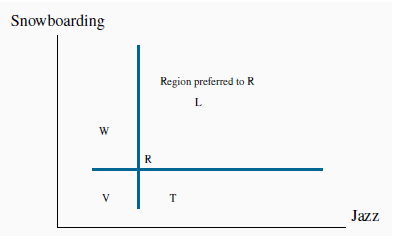
L is preferred to R since more of each good is consumed at L, while points such as V are less preferred than R. Points W and T contain more of one good and less of the other than R. Consequently, we cannot say if they are preferred to R without knowing how the consumer trades the goods off – that is, his preferences.
Without knowing the consumer’s tastes, we cannot be sure at this stage how points in the northwest and southeast regions compare with R. At W or T, the consumer has more of one good and less of the other than at R. Someone who really likes snowboarding might prefer W to R, but a jazz buff might prefer T to R.
Let us now ask Neal to disclose his tastes, by asking him to define several combinations of snowboarding and jazz that yield him exactly the same degree of satisfaction as the combination at R.
Suppose further, for reasons we shall understand shortly, that his answers define a series of points that lie on the beautifully smooth contour  in Figure 6.8. Since he is indifferent between all points on
  by construction, this contour is an indifference curve.
 An indifference curve defines combinations of
goods and services that yield the same level of satisfaction to the consumer.
An indifference curve defines combinations of
goods and services that yield the same level of satisfaction to the consumer.
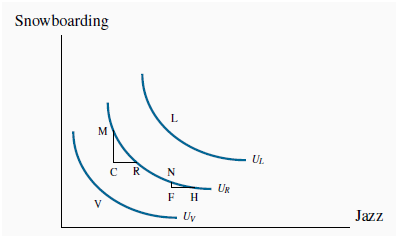
Pursuing this experiment, we could take other points in Figure 6.8, such as L and V, and ask the consumer to define bundles that would yield the same level of satisfaction, or indifference. These combinations would yield additional contours, such as UL and UV in Figure 6.8. This process yields a series of indifference curves that together form an indifference map.
 An indifference map is a set of indifference
curves, where curves further from the origin denote a higher level of satisfaction.
An indifference map is a set of indifference
curves, where curves further from the origin denote a higher level of satisfaction.
Let us now explore the properties of this map, and thereby understand why the contours have their smooth convex shape. They have four properties. The first three follow from our preceding discussion, and the fourth requires investigation.
- Indifference curves further from the origin reflect higher levels of satisfaction.
- Indifference curves are negatively sloped. This reflects the fact that if a consumer gets more of one good she should have less of the other in order to remain indifferent between the two combinations.
- Indifference curves cannot intersect. If two curves were to intersect at a given point, then we would have two different levels of satisfaction being associated with the same commodity bundle—an impossibility.
- Indifference curves are convex when viewed from the origin, reflecting a diminishing marginal rate of substitution.
The convex shape reflects an important characteristic of preferences: When consumers have a lot of some good, they value a marginal unit of it less than when they have a small amount of that good. More formally, they have a higher marginal valuation at low consumption levels—that first cup of coffee in the morning provides greater satisfaction than the second or third cup.
Consider the various points on  , starting at M in Figure 6.8. At M Neal snowboards a lot; at N he boards
much less. The convex shape of his indifference map shows that he values a marginal snowboard trip more at N than at M. To see this, consider what happens as he moves along his indifference
curve, starting at M. We have chosen the coordinates on so
that, in moving from M to R, and again from N to H, the additional amount of jazz is the same: CR = FH. From M, if Neal moves to R, he consumes an additional amount of jazz, CR. By definition
of the indifference curve, he is willing to give up MC snowboard outings. The ratio MC/CR defines his willingness to substitute one good for the other. This ratio, being a vertical distance
divided by a horizontal distance, is the slope of the indifference curve and is called the marginal rate of substitution, MRS.
, starting at M in Figure 6.8. At M Neal snowboards a lot; at N he boards
much less. The convex shape of his indifference map shows that he values a marginal snowboard trip more at N than at M. To see this, consider what happens as he moves along his indifference
curve, starting at M. We have chosen the coordinates on so
that, in moving from M to R, and again from N to H, the additional amount of jazz is the same: CR = FH. From M, if Neal moves to R, he consumes an additional amount of jazz, CR. By definition
of the indifference curve, he is willing to give up MC snowboard outings. The ratio MC/CR defines his willingness to substitute one good for the other. This ratio, being a vertical distance
divided by a horizontal distance, is the slope of the indifference curve and is called the marginal rate of substitution, MRS.
 The marginal rate of substitution is the slope of
the indifference curve. It defines the amount of one good the consumer is willing to sacrifice in order to obtain a given increment of the other, while maintaining utility unchanged.
The marginal rate of substitution is the slope of
the indifference curve. It defines the amount of one good the consumer is willing to sacrifice in order to obtain a given increment of the other, while maintaining utility unchanged.
At N, the consumer is willing to sacrifice the amount NF of boarding to get the same additional amount of jazz. Note that, when he boards less, as at N, he is willing to give up less boarding than when he has a lot of it, as at M, in order to get the same additional amount of jazz. His willingness to substitute diminishes as he moves from M to N: The quantity NF is less than the quantity MC. In order to reflect this taste characteristic, the indifference curve has a diminishing marginal rate of substitution: a flatter slope as we move down along its surface.
 A diminishing marginal rate of substitution
reflects a higher marginal value being associated with smaller quantities of any good consumed.
A diminishing marginal rate of substitution
reflects a higher marginal value being associated with smaller quantities of any good consumed.
- 4554 reads
