


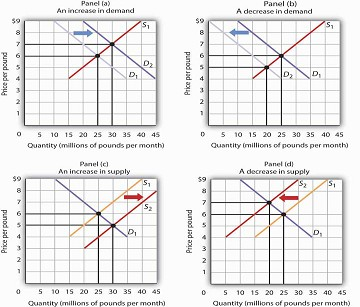
A change in demand or in supply changes the equilibrium solution in the model. Panels (a) and (b) show an increase and a decrease in demand, respectively; Panels (c) and (d) show an increase and a decrease in supply, respectively.
A change in one of the variables (shifters) held constant in any model of demand and supply will create a change in demand or supply. A shift in a demand or supply curve changes the equilibrium price and equilibrium quantity for a good or service. Figure 3.14 combines the information about changes in the demand and supply of coffee presented in Figure 3.2 Figure 3.3 Figure 3.7 and Figure 3.8 In each case, the original equilibrium price is $6 per pound, and the corresponding equilibrium quantity is 25 million pounds of coffee per month. Figure 3.14 shows what happens with an increase in demand, a reduction in demand, an increase in supply, and a reduction in supply. We then look at what happens if both curves shift simultaneously. Each of these possibilities is discussed in turn below.
- 3168 reads
