


When we draw a supply curve, we assume that other variables that affect the willingness of sellers to supply a good or service are unchanged. It follows that a change in any of those variables will cause a change in supply, which is a shift in the supply curve. A change that increases the quantity of a good or service supplied at each price shifts the supply curve to the right. Suppose, for example, that the price of fertilizer falls. That will reduce the cost of producing coffee and thus increase the quantity of coffee producers will offer for sale at each price. The supply schedule in Figure 3.7 shows an increase in the quantity of coffee supplied at each price. We show that increase graphically as a shift in the supply curve from S1 to S2. We see that the quantity supplied at each price increases by 10 million pounds of coffee per month. At point A on the original supply curve S1, for example, 25 million pounds of coffee per month are supplied at a price of $6 per pound. After the increase in supply, 35 million pounds per month are supplied at the same price (point A′ on curve S2).
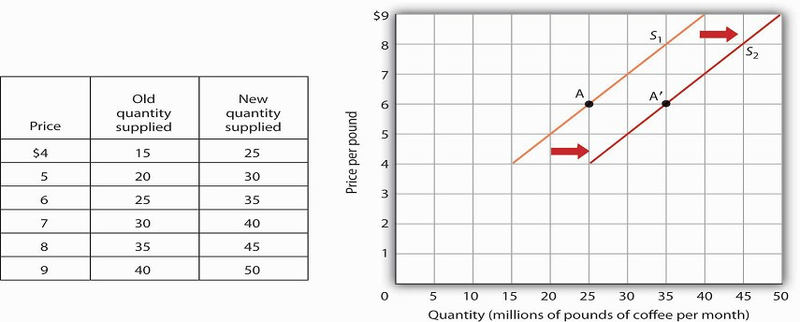
If there is a change in supply that increases the quantity supplied at each price, as is the case in the supply schedule here, the supply curve shifts to the right. At a price of $6 per pound, for example, the quantity supplied rises from the previous level of 25 million pounds per month on supply curve S1 (point A) to 35 million pounds per month on supply curve S2 (point A′).
An event that reduces the quantity supplied at each price shifts the supply curve to the left. An increase in production costs and excessive rain that reduces the yields from coffee plants are examples of events that might reduce supply. Figure 3.8 shows a reduction in the supply of coffee. We see in the supply schedule that the quantity of coffee supplied falls by 10 million pounds of coffee per month at each price. The supply curve thus shifts from S1 to S3.
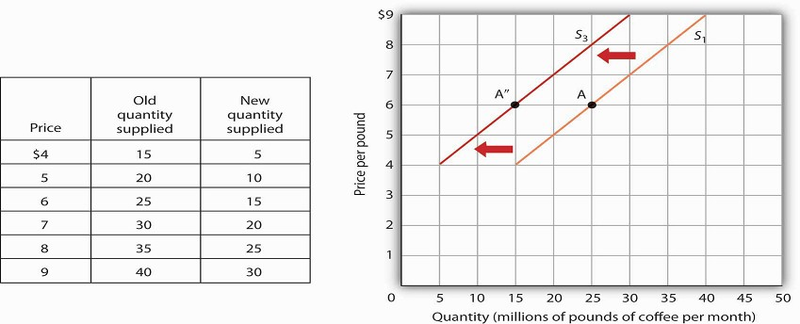
A change in supply that reduces the quantity supplied at each price shifts the supply curve to the left. At a price of $6 per pound, for example, the original quantity supplied was 25 million pounds of coffee per month (point A). With a new supply curve S3, the quantity supplied at that price falls to 15 million pounds of coffee per month (point A″).
A variable that can change the quantity of a good or service supplied at each price is called a supply shifter. Supply shifters include (1) prices of factors of production, (2) returns from alternative activities, (3) technology, (4) seller expectations, (5) natural events, and (6) the number of sellers. When these other variables change, the all-other-things-unchanged conditions behind the original supply curve no longer hold. Let us look at each of the supply shifters.
Prices of Factors of Production
A change in the price of labor or some other factor of production will change the cost of producing any given quantity of the good or service. This change in the cost of production will change the quantity that suppliers are willing to offer at any price. An increase in factor prices should decrease the quantity suppliers will offer at any price, shifting the supply curve to the left. A reduction in factor prices increases the quantity suppliers will offer at any price, shifting the supply curve to the right.
Suppose coffee growers must pay a higher wage to the workers they hire to harvest coffee or must pay more for fertilizer. Such increases in production cost will cause them to produce a smaller quantity at each price, shifting the supply curve for coffee to the left. A reduction in any of these costs increases supply, shifting the supply curve to the right.
Returns from Alternative Activities
To produce one good or service means forgoing the production of another. The concept of opportunity cost in economics suggests that the value of the activity forgone is the opportunity cost of the activity chosen; this cost should affect supply. For example, one opportunity cost of producing eggs is not selling chickens. An increase in the price people are willing to pay for fresh chicken would make it more profitable to sell chickens and would thus increase the opportunity cost of producing eggs. It would shift the supply curve for eggs to the left, reflecting a decrease in supply.
Technology
A change in technology alters the combinations of inputs or the types of inputs required in the production process. An improvement in technology usually means that fewer and/or less costly inputs are needed. If the cost of production is lower, the profits available at a given price will increase, and producers will produce more. With more produced at every price, the supply curve will shift to the right, meaning an increase in supply.
Impressive technological changes have occurred in the computer industry in recent years. Computers are much smaller and are far more powerful than they were only a few years ago—and they are much cheaper to produce. The result has been a huge increase in the supply of computers, shifting the supply curve to the right.
While we usually think of technology as enhancing production, declines in production due to problems in technology are also possible. Outlawing the use of certain equipment without pollution control devices has increased the cost of production for many goods and services, thereby reducing profits available at any price and shifting these supply curves to the left.
- 3791 reads
