


In this paragraph we analyze how quality losses propagate in the system and if it is possible to assess the effect of quality control on OEE and OTE.
First of all we have to consider that quality rate for a station is usually calculated considering only the time spent for the manufacturing of products that have been rejected in the same station. This traditional approach focuses on stations that cause defects but doesn’t allow to point out completely the effect of the machine defectiveness on the system. In order to do so, the total time wasted by a station due to quality losses should include even the time spent for manufacturing of good products that will be rejected for defectiveness caused by other stations. In this sense quality losses depends on where scraps are identified and rejected. For example, scraps in the last station should be considered loss of time for the upstream station to estimate the real impact of the loss on the system and to estimate the theoretical production capacity needed in the upstream station. In conclusion the authors propose to calculate quality rate for a station considering as quality loss all time spent to manufacture products that will not complete the whole process successfully.
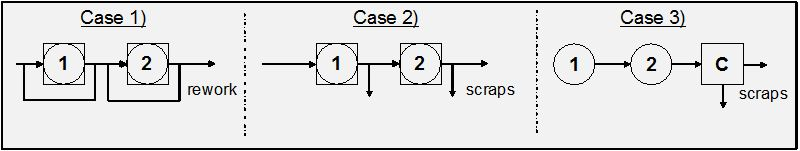
From a theoretical point of view we could consider the following case for calculation of quality rate of a station that depends on types of rejection (scraps or rework) and on quality controls positioning. If we consider two stations with an assigned defectiveness Sj and each station reworks its scraps with a rework cycle time equal to theoretical cycle time, quality rate could be formulate as shown in case 1 in Figure 3.12. Each station will have quality losses (time spent to rework products) due its own defectiveness. If we consider two stations with an assigned defectiveness Sj and a quality control station at downstream each station, quality rate could be formulate as shown in case 2 in Figure 3.12. The station 1, that is the upstream station, will have quality losses (time spent to work products that will be discarded) due to its own and station 2 defectiveness. If we consider two stations with an assigned defectiveness Sj and quality control station is only at the end of the line, quality rate quality rate could be formulate as shown in case 3 in Figure 3.12. In this case both stations will have quality losses due to the propagation of defectiveness in the line. Case 2 and 3 point out that quality losses could be not simple to evaluate if we consider a long process both in design and management of system. In particular in the quality rate of station 1 we consider time lost for reject in the station 2.
Finally, it is important to highlight the different role that the quality efficiency plays during the design phase and the production.
When the system is producing, Operations Manager focuses his attention on the causes of the delectability with the aim to reduce it. When it is to design the production system, Operations Manager focuses on the expected quality efficiency of each station, on the location of quality control, on the process (rework or scraps) to identify the correct number of equipments or station for each activity of the process.
In this sense, the analysis is vertical during the production phase, but it follows the whole process during the design ( Figure 3.13 ).
- 2746 reads
