


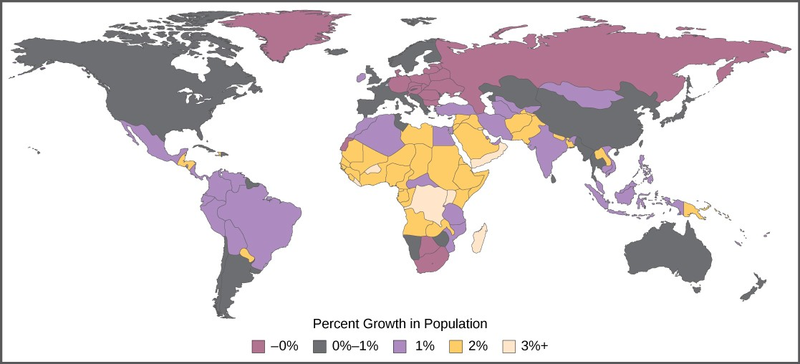
The age structure of a population is an important factor in population dynamics. Age structure is the proportion of a population in different age classes. Models that incorporate age structure allow better prediction of population growth, plus the ability to associate this growth with the level of economic development in a region. Countries with rapid growth have a pyramidal shape in their age structure diagrams, showing a preponderance of younger individuals, many of whom are of reproductive age (Figure 19.11). This pattern is most often observed in underdeveloped countries where individuals do not live to old age because of less-than-optimal living conditions, and there is a high birth rate. Age structures of areas with slow growth, including developed countries such as the United States, still have a pyramidal structure, but with many fewer young and reproductive-aged individuals and a greater proportion of older individuals. Other developed countries, such as Italy, have zero population growth. The age structure of these populations is more conical, with an even greater percentage of middle-aged and older individuals. The actual growth rates in different countries are shown in Figure 19.12, with the highest rates tending to be in the less economically developed countries of Africa and Asia.
Art CONNECTION
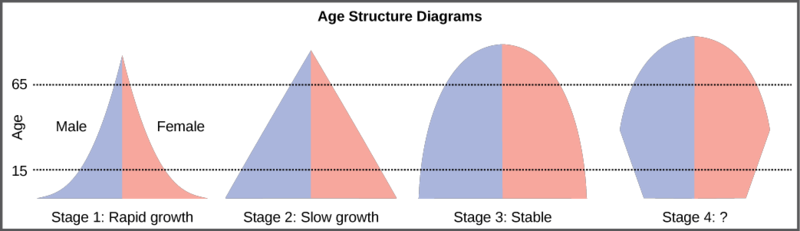
Age structure diagrams for rapidly growing, slow growing, and stable populations are shown in stages 1 through 3. What type of population change do you think stage 4 represents?
- 47790 reads
