


The BCG matrix method is based on the product life cycle theory that can be used to determine what priorities should be given in the product portfolio of a Strategic Business Unit (SBU). To ensure long-term value creation, a company should have a portfolio of products that contains both high-growth products in need of cash inputs and low-growth products that generate a lot of cash. This model can be explained in two dimensions: relative market share and market growth. The basic idea behind this model is that the larger the market share a product has relative to its competitors or the faster the product's market grows, the better it is for the company in an economic sense. The key components of the matrix are illustrated in Figure 3.6 and discussed below:
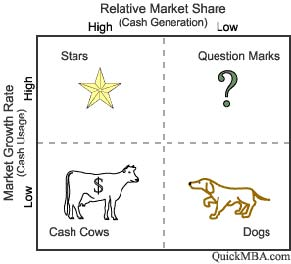
- Stars (high market growth, high relative market share). These are products that require large amounts of cash and are also leaders in the business and therefore they should also generate large amounts of cash. They are frequently roughly in balance on net cash flow.
- Cash Cows (low market growth, high relative market share). These are products that generate high amounts of profit and cash, and because of the low growth, investments needed should be low.
- Given its characteristics, companies should avoid and minimize the number of products in this category. If the product does not deliver cash, it may be discontinued.
- Question Marks (high market growth, low relative market share). These products have the worst cash characteristics of all, because of high cash demands and low returns due to low market share. If nothing is done to change the market share, question marks will simply absorb great amounts of cash and later, as the growth stops, it may become a dog. So, managers should either invest heavily in order to improve market share, or sell off/invest nothing and generate whatever cash is possible.
- 7092 reads
