


Management seeks to give maximum service at minimum cost. Better scheduling can result in significant cost savings while still maintaining the level of service. What is needed is a method for approaching scheduling problems. What are known as decision trees can help, by setting down the range of possible scheduling decisions and their potential consequences in an organized fashion. 1
Define the problem
The first step is to determine the nature of the problem. If we are concerned with weekend staffing, it would be necessary to concentrate on examining the sales and customer counts for past weekends. Business for a hotel or restaurant is often different during days of the week or months of the year. A hotel may enjoy nearly full occupancy in midweek but be empty on weekends. The rule of thumb is that if guest or customer counts vary by more than 10 per cent for a particular time period, a separate analysis should be conducted. If Monday through Friday occupancy is 80 per cent and weekend occupancy is 65 per cent, these require two distinct staffing decisions.
Determine the staffing alternatives
Management's challenge is to schedule employees under conditions of demand uncertainty. To reduce that uncertainty, management uses past data as a foundation for future demand projections. Let us assume that the problem is staffing for Sunday brunch. The customer count for the previous year's Sundays would be plotted on a line, omitting any unusual days such as Mother's Day or Easter Sunday. These occasions would require separate consideration. Having plotted the previous business, management can divide the data into three levels of demand: low, medium, and high. A staffing pattern can be determined for each level of demand by applying productivity standards to the customer counts. For the low demand of 90 to 120 customers, four servers and three cooks might be needed; for 120 to 150 customers, it might be six servers and four cooks; for the high demand of 150 to 200 customers, eight servers and five cooks might be appropriate. It might be found, for example, that out of 50 previous Sundays, customer demand was low on 10, medium on 29, and high on 11 days. The median number of customers, the midpoint when arranging the data in ascending order, is 100, 135, and 170 for the low, medium, and high levels, respectively. This information, as described in Exhibit 5, helps determine staffing needs.
Because of the uncertainty of demand, the restaurant could end up with employees standing around idle if business is less than forecast, or with unhappy customers waiting excessive amounts of time if demand is more than forecast. To reduce the uncertainty, management next should determine the probability of each level of demand. This is the number of days with a level of demand, divided by the total number of days. The results in our example are 0.2 (10 divided by 50) for low demand, 0.58 (29 divided by 50) for medium demand, and 0.22 (11 divided by 50) for high demand.
Costing out the alternatives
If we assume that the cost per employee for brunch is USD 14 for servers and USD 30 for cooks, we can determine the staffing cost per shift at various levels of business. For low demand, the employee cost would be USD 146 (four servers at USD 14 each plus three cooks at USD 30 each); for medium demand, the cost increases to USD 204 (with two additional servers and another cook); for high demand, the cost jumps to USD 262 (with two more servers and one more cook needed).
|
Low XXXXX |
Medium XXXXXXXXXXXXXXX |
High XXXXXX |
|
XXXXX |
XXXXXXXXXXXXXX 150 |
XXXXX 200 |
Determine the revenue
To determine the expected revenue, it is necessary to know the average customer check. This is obtained by dividing total sales revenue by the number of customers. Let us assume that the average check is USD 12. Projected revenue is obtained by multiplying the median number of customers at a given level of demand by the average check.
If we scheduled eight servers and five cooks, demand could be handled at all levels. At a high level of demand, revenue would be USD 2,040 (170 customers at an average of USD 12 each); with medium demand, revenue would be USD 1,620 (135 times USD 12); with low demand, revenue would be USD 1,200 (100 times USD 12).
If we scheduled six servers and four cooks, demand at low and medium levels could be handled. The appropriate revenue figures would still be USD 1,200 and USD 1,620, respectively. At a medium level of staffing, however, the maximum number of customers who could be handled without loss of service would be 150 ( Exhibit 5). Customers beyond this number would be unwilling to wait for the time necessary to be seated and served. Thus, maximum revenue even during high demand would be USD 1,800 (150 times USD 12).
If we scheduled only four servers and three cooks, they could handle a maximum of only 120 customers. Staffing would be sufficient to handle low demand; the revenue generated would be USD 1,200. At medium or high demand, however, maximum revenue would be limited to the 120 customers who could be handled successfully with a low-demand staff (Exhibit 5). Maximum revenue for both medium and high demand would be limited to USD 1,440 (120 times USD 12).
Prepare the decision tree
A decision tree identifies the decisions to be made and their consequences. By incorporating measures of uncertainty, expected payoffs for each decision can be estimated in order to arrive at the best choice. A decision tree for this problem (which need not be vertical to be called a tree) is depicted in Exhibit 6. Management must make a decision to staff at a high, medium, or low level.
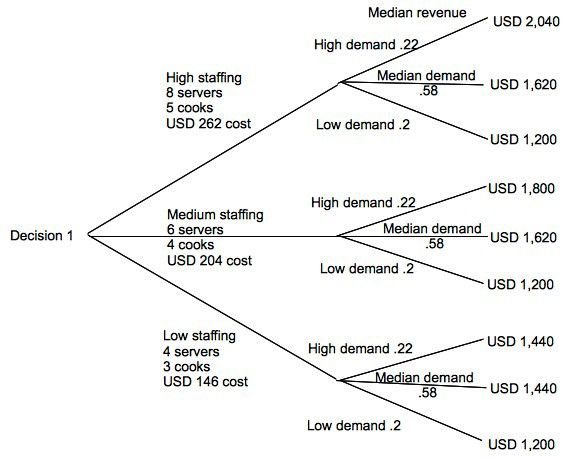
The employee cost of that decision is USD 262, USD 204, or USD 146, respectively. The tree branches off into a line for each level of staffing.
Customer demand may be high, medium, or low, so each staffing branch is divided further. The probabilities associated with those levels are listed, as is the expected revenue at each level of demand.
Evaluating the consequences
The next step is to determine the yield or net revenue from each alternative, to arrive at the best choice.
The expected average revenue is found by multiplying the probability of each alternative by its yield and adding the totals. This is known as the expected value (EV) method. Referring to Exhibit 6, the expected value, EV, at high staffing is USD 1,628.40. (EV = [0.22 times 2,040] plus [0.58 times 1,620] plus [0.2 times 1,200].) Subtracting the cost of staffing, 262, the net yield is USD 1,366.40. At medium staffing, the EV is USD 1,611.60. (EV = [0.22 times 1,800] plus [0.58 times 1,620] plus [0.2 times 1,200].) Subtracting the cost of staffing, 204, the net yield is USD 1,371.60. At low staffing, the EV is USD 1,392. (EV = [0.22 times 1,440] plus [0.58 times 1,440] plus [0.2 times 1,200].) Subtracting the cost of staffing (146), the net yield is USD 1,246.
Choosing the best alternative
The net yields for high, medium, and low staffing are USD 1,366.40, USD 1,371.60, and USD 1,246, respectively. Given the assumptions that have been made, staffing at a medium level is preferred. When demand is not as expected, employee labor could be stored in ways identified previously.
Management may decide to staff at a lesser level, however, to generate occasional lines of waiting customers. This strategy may be important from a marketing perspective; a line of customers may generate a reputation for the restaurant as an action place. It should be noted, however, that if our assumptions hold true, over the long run high staffing will generate higher net yield.
The above discussion does indicate that the decision tree can only establish the net yields of the alternatives. The decision rests with management. That decision may be influenced by marketing or service considerations outside of net revenue.
Sensitivity analysis
Sensitivity analysis refers to the process of recalculating the yields based on different assumptions. If wages increase or the probability of demand is reduced, the decision tree must be recalculated to arrive at updated net yields.
- 4078 reads
