


The top two panels in Figure 2.1 Diverse illustrations of macroeconomics provide information on some key indicators of the state of the economy. The announcement from the Bureau of Economic Analysis (BEA) concerns one of the most closely watched indicators of the macroeconomy: real gross domestic product (real GDP). This is a measure of the goods and services produced by an economy in a year. We discuss real GDP in every macroeconomic application in this book.
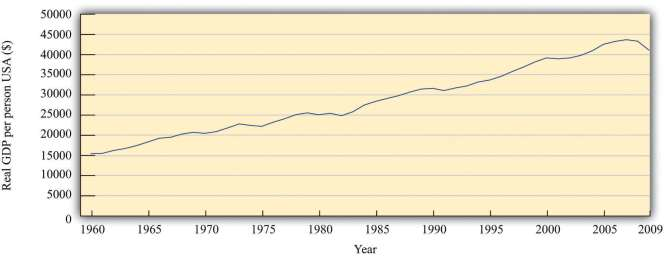
Figure 2.3 Real GDP per Person in the United States, 1960–2009 shows real GDP per person (often called real GDP per capita) from 1960 to 2009. Pictures like this one show up all the time in newspapers, in magazines, on television, or on the Internet. One of the things you will learn in your study of macroeconomics is how to interpret such economic data. We devote an entire chapter to understanding exactly how real GDP is measured. For now, we draw your attention to some details to help you appreciate what the graph means.
The horizontal axis indicates the year. Real GDP per person is shown on the vertical axis. To read this graph, you would look at a particular year on the horizontal axis, such as 2000, and then use the curve to see that the real GDP per person in 1965 was about $39,000.
If you look at this picture, the single most notable thing is that real GDP per person has been increasing. It was about 2.6 times larger in 2009 than in 1960. This tells us that, on average, the typical individual in the United States was 2.6 times richer in 2000 compared to 1960. The increase in GDP is not caused by the fact that there are more people in the economy because the figure shows GDP per person. The increase in GDP is not because prices are going up: the word real in this discussion means that it has been corrected for inflation. 1
Another thing you can see from the picture is that the growth of the economy has not been smooth. Sometimes the economy grows fast; sometimes it grows more slowly. Sometimes there are even periods in which the economy shrinks rather than grows. From this figure, you can see that real GDP per person decreased in the mid-1970s, the mid-1980s, and most notably in 2008 and 2009. During these times, people were becoming poorer on average, not richer.
We keep using the phrase on average. This reminds us that, even though the economy as a whole has been getting richer, the picture doesn’t tell us anything about how those gains have been shared across the economy. In fact, some people became a lot richer over this period, while many others saw only small gains, and some became poorer.
We see this uneven distribution very clearly when the economy shrinks. When that happens, one of the things we also observe is that more people in the economy are unemployed—that is, they are looking for a job but unable to find one. The burden of an economic downturn is borne disproportionately by those who lose their jobs.
Although this figure displays the history of the US economy over these 50 years, similar figures can be constructed for other countries around the world. They do not all look identical, but the pattern of uneven growth that we observe for the United States is one that we also see for most other countries. However, it is not true everywhere. We will also see examples of countries that have become poorer rather than richer in recent decades.
Real GDP is the most frequently watched indicator of economic performance. A second key indicator is the one in the top right screen ofFigure 2.1 Diverse illustrations of macroeconomics : the inflation rate. The Bureau of Labor Statistics (BLS) collects information on prices on an ongoing basis; each month it releases information on how fast prices are changing. The rate at which prices are changing is the inflation rate. Other countries similarly have government agencies entrusted with gathering information about the inflation rate and other economic indicators. It may seem that the job of the BLS is pretty easy: get information on prices and report it. Their task is, in fact, rather complex. In part, it is difficult because there are so many goods and services in the economy. So when we say that prices are increasing, we must decide which goods and services we are talking about. In addition, new goods appear, and obsolete goods disappear; the BLS must take this into account. And the quality of goods changes as well. If the price of a computer increases, is this an example of inflation or does it reflect an increase in the quality of the computer?
What are the implications of an inflation announcement? All else being the same, higher prices mean that we are unable to afford goods and services we were able to buy when prices were lower. But “all else” is not the same. Generally when prices increase, wages also increase. This means that the overall effects of inflation on our ability to buy goods and services are not self-evident.
Another implication of inflation is the policy response it elicits. The monetary authorities in the United States and many other countries are focused on ensuring that inflation does not get out of control. A report of inflation might therefore lead to a response by a monetary authority. Inflation affects us directly through the prices we pay and the wages we receive and indirectly through the policy response it induces.
Though not included in our screens, another significant variable also indicates the state of the macroeconomy: the rate of unemployment. The BLS (http://www.bls.gov/news.release/empsit.toc.htm) reports the unemployment rate on a monthly basis. It measures the fraction of people in the labor force who do not have a job. When real GDP is relatively high, then the unemployment rate tends to be lower than average, but when real GDP decreases, more people find themselves out of a job.
- 1399 reads
