


We now have the three pieces we need to understand the relationship between monetary policy, inflation, and real GDP:
- The Taylor rule linking the real interest rate to the inflation rate (***Figure 10.15 "The Taylor Rule")
- The inverse relationship between the real interest rate and real GDP (***Figure 10.10 "The Relationship between the Real Interest Rate and Real GDP")
- The price adjustment process (***Figure 10.12 "Price Adjustment")
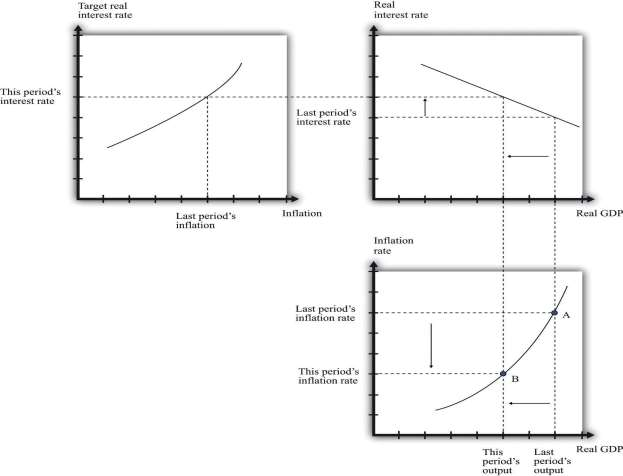
Together, these three pieces paint a complete picture of the monetary policy process. The top left panel in Figure 10.16 "The Adjustment of Inflation over Time" is taken from**Figure 10.15 "The Taylor Rule" and shows a positive relationship between inflation and the real interest rate. The top right panel in Figure 10.16 "The Adjustment of Inflation over Time" is taken from **Figure 10.10 "The Relationship between the Real Interest Rate and Real GDP" and shows the relationship between real GDP and the interest rate. As shown in the figure, the higher the real interest rate, the lower real GDP is. As a reminder, higher real interest rates lead to lower aggregate spending. Finally, from the price-setting equation, changes in real GDP lead to changes in the inflation rate. We showed this previously in **Figure 10.12 "Price Adjustment", and it appears in the bottom right panel of **Figure 10.16 "The Adjustment of
Inflation over Time". If real GDP decreases, the output gap increases, and the inflation rate decreases.
We can use ********Figure 10.16 "The Adjustment of Inflation over Time" to summarize the conduct of monetary policy. In this diagram, we see the Taylor rule in action: the Fed sees high inflation and so increases the real interest rate.
- Start at the top right panel with “Last Period’s Interest Rate.” The panel shows us the level of real GDP that resulted from the interest rate choice. The bottom right panel then shows the inflation rate that came from the price adjustment equation. Point A therefore shows the state of the economy last period—that is, it shows last period’s inflation and last period’s real GDP. This is the information that the Fed uses when making its decision for this period.
- Given last period’s inflation rate, the top left panel shows us the value of the real interest rate that the Fed wants to choose this period. The Fed therefore sets a new target for the federal funds rate. This increases real interest rates, both short term and long term, which in turn leads to a decrease in durable goods spending.
- From the top right panel we can see that the Fed has chosen a higher interest rate than last period, which means that there is a decrease in real GDP.
- Decreased real GDP causes the inflation rate to decrease, as we see in the bottom right panel.
- Coming up to its next meeting, the FOMC again looks at the current state of the economy (point B), and the process begins again.
We have simplified the discussion here in two ways. First, we neglected the fact that the output gap also enters into the Taylor rule. The basic idea remains the same in that more complicated case. Second, we did not discuss autonomous inflation. Autonomous inflation, remember, captures managers’ expectations of future inflation and future demand conditions. It, too, will tend to change over time. Theories of autonomous inflation are a subject for more advanced courses in macroeconomics.
KEY TAKEAWAY
The price adjustment equation describes the dependence of price changes (inflation) on the output gap, given the autonomous inflation rate.
Given prices, monetary policy influences the output gap. Over time, prices adjust in response to the effects of monetary policy on the output gap.
The Taylor rule describes the dependence of the interest rate targeted by the Fed on the inflation rate and the output gap.
***
Checking Your Understanding
Describe why a reduction in the target interest rate will ultimately lead to higher inflation.
If the economy is in a recession, what should happen to the target interest rate according to the Taylor rule?
- 2286 reads
