


Remember that we defined the change in prices as follows:
We can use the data in Table 3.1 Calculating Nominal GDP to calculate this ratio as well. This time, however, we compare the cost of the same basket of goods (in this case, output in 2013) according to the prices prevailing at two different times. The basket of goods in 2013 is shown in Table 3.4 Calculating the Price Index as the quantities of the three goods and services produced that year: 12 T-shirts, 60 music downloads, and 5 meals. As we saw earlier, the cost in dollars of this basket of goods and services is $442.
|
Year |
T-shirts |
Music Downloads |
Meals |
Cost of 2013 Basket ($) |
Price Index |
|||
|
Price($) |
Quantity |
Price($) |
Quantity |
Price($) |
Quantity |
|||
|
2012 |
20 |
12 |
1. |
60 |
25 |
5 |
425 |
1.00 |
|
2013 |
22 |
12 |
0.80 |
60 |
26 |
5 |
442 |
1.04 |
Table 3.4 Calculating the Price Index also shows the total cost of consuming the 2013 basket in 2012, which we already know is $425. Thus the price index for 2012 is $425/$425 = 1, and the price index for 2013 is $442/$425 = 1.04. 1 For the simple three-good economy described in Table 3.1 Calculating Nominal GDP, we therefore have the following:
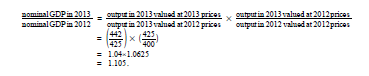
Prices increased by 4 percent, real GDP increased by 6.25 percent, and nominal GDP increased by 10.5 percent.
To summarize, the basic principle for calculating inflation is as follows: (1) We decide on a bundle of goods and look at how much it costs in a given year. (2) Then we look at the same bundle of goods in the following year and see how much it costs. (3) The ratio of the two is called a price index and provides a measure of one plus the inflation rate.
Toolkit: Section 16.5 "Correcting for Inflation"
A price index for a given year is calculated as the cost of a bundle of goods in that year divided by the cost of the same bundle in the base year. The growth rate of the price index from one year to the next is a measure of the inflation rate.
- 2272 reads
