


Figure 3.5 Real GDP in the United States, 1929–2009 shows real GDP for the US economy from 1929 to 2008 in year 2000 dollars. The figure shows that the US economy grew substantially over those years. The level of real GDP was $865.2 in 1929 and $10,842 in 2008 (in billions of $2000). 1
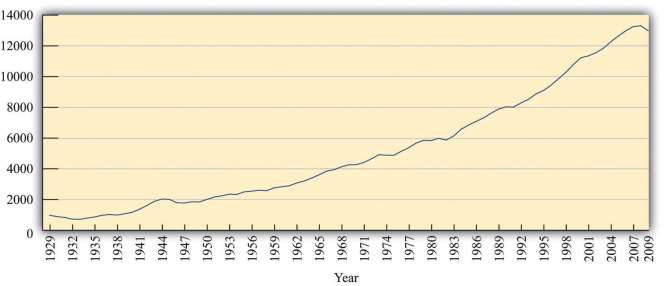
Figure 3.6 Real GDP (in 1993 Pesos) in Argentina in the 10 Years Prior to 2002 shows real GDP in Argentina and thus reveals that our earlier data for nominal GDP were indeed misleading. Nominal GDP may have increased between 1993 and 2002, but real GDP in 2002 was at the same level as in the previous decade. Moreover, real GDP had been decreasing for the prior four years before the IMF visit.
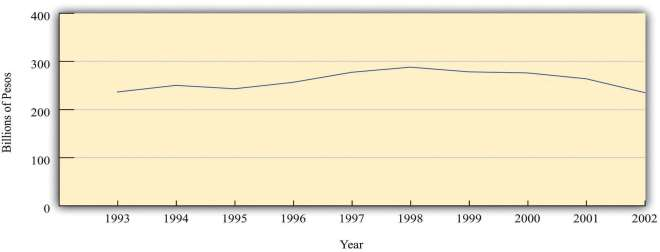
This helps you to make sense of your contradictory impressions of Buenos Aires. Argentina became poorer, not richer, in the late 1990s and early 2000s. The presence of luxury goods stores, for example, is a reminder that Argentina was a relatively rich country, but the absence of shoppers in those stores tells you that people are not feeling very rich at this time.
KEY TAKEAWWAYS
- Economists and policymakers measure output as GDP. This is a measure of the total value of all production in an economy.
- Nominal GDP measures the total value of all production using current prices, while real GDP measures total output and corrects for changes in prices relative to a base year.
Checking Your Understanding
- Why is there no “natural unit” for calculating real GDP in an actual economy compared to the pizza economy?
- If your income is currently $150 each week and you received a raise of $50, what is the percentage change in your weekly income?
- 2624 reads
