


When GDP decreases, there can be an induced decrease in investment: declines in income lead firms to anticipate lower production in the future, meaning they see less of a need to build up their capital stock. But the changes in investment during the Great Depression were very large. Because it is implausible that such large variation was the result of changes in output alone, economists look for additional explanations of why investment decreased so much during the Great Depression.
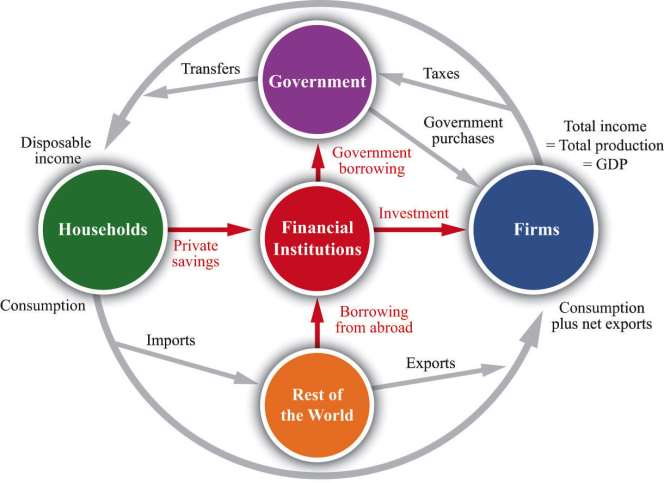
During the Great Depression, the link between savings and investment was disrupted by bank failures. Between 1929 and 1933, a number of US banks went out of business, often taking the savings of households with them. People began to trust banks less, and many households stopped putting their savings into the financial sector. The financial sector is an intermediary between households and firms, matching up the supply of savings from households with the demand for savings by firms. ***Figure 7.11 "The Financial Sector in the Circular Flow of Income" shows the flows in and out of the financial sector. (Our focus here is on the role of this sector in matching savers and investors. As ***Figure 7.11 "The Financial Sector in the Circular Flow of Income" shows, however, funds also flow into (or from) the financial sector from the rest of the world and the government sector.)
To understand bank failures in the Great Depression, we need to take a moment to review what banks do. A bank is an institution that accepts money (“bank deposits”) from individuals. It then takes some of that money and puts it into longer-term projects—the construction of an apartment building, for example. The bank in this case issues a long-term loan to the company that plans to construct the new building.
At any time, a bank has a portfolio of assets. Some are liquid; they are easily and quickly exchanged for cash. Some are illiquid; they cannot easily be converted into cash. Banks keep some assets in a highly liquid form, such as cash or very short-term loans, and also hold assets that are relatively illiquid, such as a two-year loan to a construction company.
At any time, depositors at a bank can choose to withdraw their money. Under normal circumstances, people are happy to leave most of their money in the bank, so only a small fraction of depositors want to withdraw money on any given day. The bank keeps some cash in its vaults to accommodate this demand. But suppose that times are not normal. Suppose that, as was the case during the Great Depression, depositors start to see that other banks are going out of business. Then they may worry that their own bank is also at risk of failing, in which case they will lose their savings. The natural response is to rush to the bank to withdraw money before the bank fails.
If a large number of depositors all try to withdraw money at once, the bank will run out of cash and other liquid assets. It will not be able to meet the needs of its depositors. The consequence is a bank run. And if the bank is unable to meet its depositors’ demands, it may be forced out of business altogether. This is known as a bank failure.
A striking feature of a bank failure caused by a bank run is that it is a self-fulfilling prophecy:
- If everybody believes that the bank is safe, then no one will withdraw money, and the bank will indeed be safe.
- If everybody believes that the bank is going to fail, then everyone will try to withdraw money, and the bank will indeed fail.
Notice that every individual’s decision about what to do is based on what that individual expects everyone else will do.
***Figure 7.12 "Payoffs in a Bank-Run Game" presents the decisions underlying a bank run in a stylized way. Imagine that you deposit $100 in the bank. The table in the figure shows how much you obtain, depending on your own actions and those of other depositors. You and the other depositors must decide whether to leave your money in the bank (“don’t run”) or try to take your money out of the bank (“run”). If everyone else leaves money in the bank, then you can withdraw your money and get $100 or leave it in the bank and get the $100 plus $10 interest. If others do not run, then it is also best for you not to run. But if everyone else runs on the bank, then you get nothing if you leave your money in the bank, and you can (in this example) recover $20 if you run to the bank along with everyone else. Thus, if you expect others to run on the bank, you should do the same.
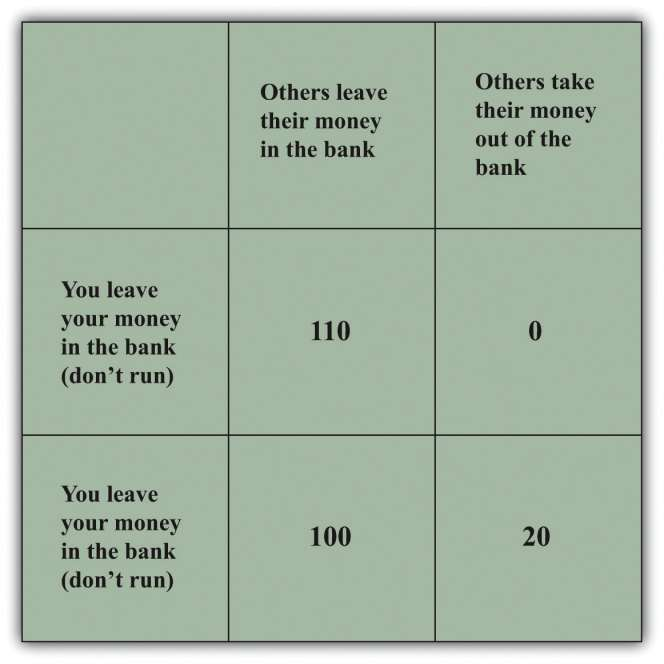
Economists call this situation a coordination game. In a coordination game, there are multiple equilibria. In this example, there is one equilibrium where there is no run on the bank, and there is another equilibrium where everyone runs to the bank to withdraw funds.
Toolkit: Section 16.9 "Nash Equilibrium"
You can find more details on coordination games in the toolkit.
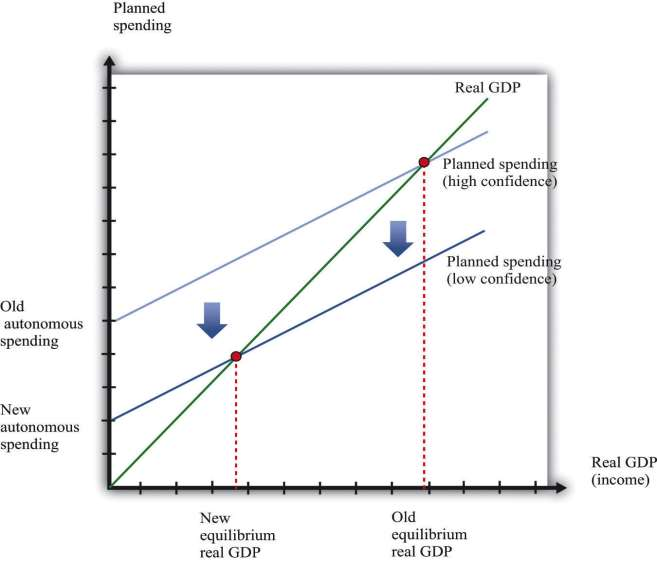
During the Great Depression, a story such as this played out not only at one bank but at many. Figure 7.13 shows what happened in terms of the aggregate expenditure framework. Prior to the Great Depression, the economy was in a “high confidence” equilibrium, in which the banking system was healthy and confidence was high. Then—for some reason—people became nervous about leaving money in banks, and it became much harder for firms to obtain loans. The cost of borrowing—the real interest rate—increased, and investment decreased substantially. The planned spending line shifted downward, and the economy moved to the bad “low confidence” equilibrium. The downward shift in planned spending leads to a decrease in real GDP, given the existing level of prices.
***Figure 7.13 should look familiar; it is the same as part (b) of ***Figure 7.10 "A Decrease in Aggregate Expenditures". This is because a decrease in autonomous consumption and a decrease in autonomous investment both look the same in the aggregate expenditure model, even though the underlying story is different. Of course, it is also possible that both autonomous consumption and autonomous investment decreased.
To summarize, the banking crisis made households reluctant to put money in the banks, and banks were reluctant to make loans. Two banking measures help us see what was happening. The currency-deposit ratio is the total amount of currency (that is, either banknotes or coins) divided by the total amount of deposits in banks. The loan-deposit ratio is the total amount of loans made by banks divided by the total amount of deposits in banks.
If the currency-deposit ratio is low, households are not holding very much cash but are instead keeping wealth in the form of bank deposits and other assets. The currency-deposit ratio increased from 0.09 in October 1929 to 0.23 in March 1933. [***See Milton Friedman and Anna Schwartz, A Monetary History of the United States, 1867– 1960 (Princeton, NJ: Princeton University Press, 1963), Table B3.***] This means that households in the economy started holding onto cash rather than depositing it in banks. You can think of the loan-deposit ratio as a measure of the productivity of banks: banks take deposits and convert them into loans for investment. During the Great Depression, the loan-deposit ratio decreased from 0.86 to 0.73. [***See Ben Bernanke, “Nonmonetary Effects of the Financial Crisis in the Propagation of the Great Depression,” American Economic Review 73 (1983): 257–76, Table 1.***]
- 2706 reads
