


The market demand for housing is shown in ***Figure 4.1 "The Market Demand for Houses". We call this the market demand curve because it reflects the choices of the many households in the economy. In macroeconomics, we typically look at markets at this level of aggregation and do not worry much about the individual decisions that underlie curves such as this one.
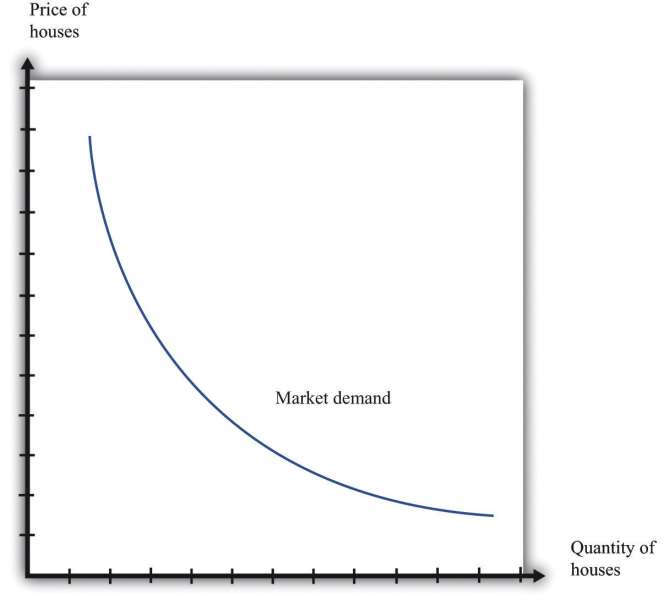
As the price of housing decreases, the quantity demanded increases. This is an example of the law of demand, which derives from two effects:
- As the price of a good or service decreases, more individuals choose to buy a positive quantity rather than zero.
- As the price of a good or a service decreases, individuals choose to buy a larger quantity.
In the case of the market for housing, the first of these is more important. Most people own either zero houses or one house. As houses become cheaper, more people decide that they can afford a house, so the quantity demanded increases. A few people might decide to buy an additional house, but they would presumably be in the rich minority. For other goods, such as chocolate bars or shoeshines, the second effect is more important: as price decreases, people increase the quantity that they buy.
- 1599 reads
