


We just observed that there are many different assets and thus many interest rates in the economy. But these interest rates are all linked to each other because the same people (particularly banks and other financial institutions) trade in many different markets. One way in which assets differ is in terms of their maturity. To see how the returns on assets of different maturity are linked, consider two government bonds of different maturities: one-year bonds and two-year bonds. Here are two different ways you could save for two years.
- Buy a one-year government bond. Collect the payment at the end of the year and then reinvest that money in another one-year bond.
- Buy a two-year government bond.
There are three interest rates relevant to your choice. The first one is the current interest rate on a one-year bond. The second is the interest rate on a one-year bond next year. The third interest rate is the annualized nominal interest rate on a two-year government bond. An annualized interest rate is the interest rate earned each year on a loan that lasts many years, and the annualized interest factor is (1 + the annualized interest rate). For example, suppose that the annualized rate on a two-year loan is 6 percent. Then you would earn 6 percent per year for two years, and
repayment after two years = $100 × 1.06 × 1.06 = $112.36.
As you might expect, these three interest rates are connected, and we can understand how by again thinking about arbitrage. If you purchase the two-year government bond return, you get
100 × (annualized nominal interest factor on two-year bond)2.
Conversely, if you purchase the two one-year bonds, you get
100 × (nominal interest factor this year) × (expected nominal interest factor next year).
Notice that we have referred to next year’s interest factor as “expected.” This is because when you make your decision, you do not know what the interest rate will be.
When
(annualized nominal interest factor on two-year bond)2 = nominal interest factor this year× expected nominal interest factor next year,
the two transactions have the same return. Once again, we can appeal to an arbitrage argument to say that we expect this equation to hold. There is one twist, however. When you make this decision, you do not know for sure what the interest rate will be on one-year bonds next year. You have to make a guess. Thus this arbitrage involves some risk.
This relationship is an example of the term structure of interest rates, which describes the relationship between the actual and expected returns on assets that are identical except for their maturities. A version of the relationship applies to not only assets of one-year and two-year maturity but also assets of all maturities.
From the term structure of interest rates, we learn something very significant: if the annual one-year interest rate is below the annual rate on a two-year loan, then interest rates are expected to increase in the future. For example, if the annual one-year interest rate is 5 percent and the annual rate on two-year loans is 6 percent, this means both borrowers and lenders expect one-year interest rates to be higher than 6 percent next year. (If desired, you can calculate exactly what the expected rate is by using the previous equation.)
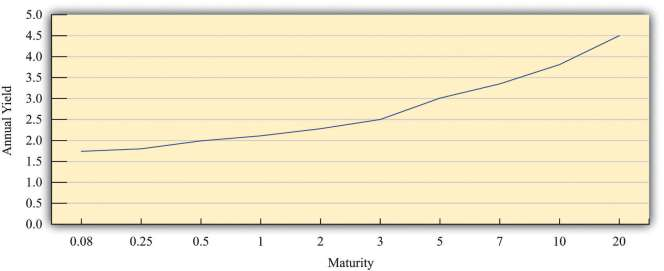
We can see the connection between assets of different maturities by looking at the yield curve. [***For more details and additional graphs, see J. Huston McCulloch, “The US Real Term Structure of Interest Rates: With Implicit Inflation Premium,” updated October 30, 2009, accessed August 22, 2011, http://www.econ.ohio-state.edu/jhm/ts/ts.html.***] The yield curve shows the current annual return for assets of different maturities. ***Figure 9.10 "The Yield Curve" shows the yield curve for US Treasury securities in 2011. [***This is an average of rates in 2011 for US Treasury securities of different maturities fromhttp://www.econstats.com/r/rusa_ew6.htm.***] On the horizontal axis of the yield curve is the number of years to maturity of the asset. On the vertical axis is the current annual yield on the asset. Notice that the yield curve is upward sloping: the longer the maturity, the higher the annual interest rate. This is generally what we observe, although sometimes the yield curve is inverted, meaning that higher maturity debt has a lower interest rate.
All assets are linked, not just government bonds of different maturities. Suppose that the interest rate on one-year government bonds increases. To buy these bonds, financial institutions will start selling other assets—not only bonds at other maturities but also stocks, holdings of foreign currencies, and so on. As they sell those other assets, their prices will decrease, and their rate of return will increase. An increase in the interest rate on one-year treasuries therefore increases interest rates on other assets. Thus different interest rates typically move together, and it is usually not too misleading, at least for the purposes of macroeconomics, to think about there being a single interest rate in an economy.
- 1696 reads
