


In our pizza economy, it is easy to tell the difference between an increase in production and an increase in prices. We can measure increased production by counting the number of pizzas, and we can measure increased prices by looking at the price of a pizza. We call the number of pizzas real gross domestic product (GDP) (the word real here indicates that we are effectively measuring in terms of goods and services rather than dollars), and we call the price of a pizza the price level in the economy.
Then it follows that
nominal GDP = price level × real GDP.
In our example, the price level is 10 pesos, and real GDP is 30 billion pizzas. Multiplying these numbers together, we find that nominal GDP is indeed 300 billion pesos. Sometimes, for shorthand, we use the term price to mean the price level in a given year and the term output to mean real GDP in a given year.
Real GDP is the variable that most interests us because it measures the quantity of goods and services produced in an economy. We would therefore like to find a way to decompose nominal GDP into the price level and the level of real GDP in actual economies. But real economies produce lots of different goods and services, the prices of which are continually changing. In addition—unlike our fictional economy, where it makes sense to measure real GDP as the number of pizzas—there is no “natural unit” for real GDP in an actual economy.
In fact, even in our pizza economy, there is still an arbitrariness about the units. Imagine that we cut each pizza into 10 slices. Then we could just as easily say that real GDP is 300 billion pizza slices instead of 30 billion pizzas, but that the price level—the price per slice—is 1 peso. We would still conclude that nominal GDP—the number of slices multiplied by the price per slice—was 300 billion pesos.
So is it possible to say, in a real economy producing multiple goods and services, that nominal GDP is equal to the product of the price level and the level of real GDP? Does it still make sense to write
nominal GDP = price level × real GDP
as we did for the pizza economy? The answer, as it turns out, is yes.
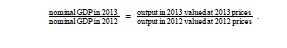
To see how this works, we begin by looking at how prices and output change from one year to another. Specifically, we divide 2013 nominal GDP by 2012 nominal GDP. This is one measure of the growth in nominal GDP from 2012 to 2013. [***Specifically, this measures the gross growth rate of nominal GDP. It is equal to 1 + the percentage change in nominal GDP. See the toolkit for details of the mathematics of growth rates. ***] Remember that nominal GDP equals total output produced in a year, valued at the prices prevailing in that year. Comparing nominal GDP in 2012 and 2013 therefore gives us
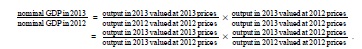
Now we use a trick. Multiply above and below the line by “output in 2013 valued at 2012 prices” and then rearrange:
Look carefully at this calculation to make sure you understand what we did here.
Now examine the two ratios on the right-hand side of the second line. The first compares the cost of the same bundle of goods (output in 2013) at two different sets of prices—those prevailing in 2013 and those prevailing in 2012. Think of the bundle as being a grocery cart full of goods. If you compare how much it costs to buy exactly the same collection of goods at two different times, you have a measure of what has happened to prices.
The second ratio on the right-hand side is a measure of the increase in real GDP. It uses the same prices to compare the value of output in 2012 and 2013. In other words, it tells you how much it costs to buy two different collections of goods at exactly the same prices.
To reiterate, the first ratio compares the same bundle of goods at two different sets of prices. The second ratio compares two different bundles of goods at the same prices. We have succeeded in separating the change in nominal GDP into two components: a price change and a change in real GDP.
Measuring Real GDP and the Price Level
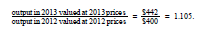
We can illustrate this technique using the data in Table 3.1 Calculating Nominal GDP. In that example, the growth in nominal GDP equals 10.5 percent because
Now we choose an arbitrary year that we call the base year. For the base year, we set the price level equal to 1. In our calculations, we choose 2012 as our base year. Because nominal GDP equals the price level times real GDP, this means that real GDP in 2012 is $400. When we choose 2012 as our base year, we use the prices of T-shirts, music downloads, and meals in 2012 for our calculations of real GDP for 2012 and 2013. Table 3.3 Real GDP Using 2012 as the Base Year shows what we find. The first row is exactly the same as in Table 3.1 Calculating Nominal GDP. Nominal GDP in 2012 is—by definition—the same as real GDP in 2012 because we are using 2012 as the base year. The second row of the table calculates real GDP for 2013; it uses 2013 quantities but 2012 prices. Notice also the heading in the final column of the table: “Real GDP (Year 2012 dollars).” The term in parentheses tells us that everything is being measured according to the prices that prevailed in our base year of 2012.
|
Year |
T-shirts |
Music Downloads |
Meals |
Nominal GDP($) |
||||||
|
Price($) |
Quantity |
Price($) |
Quantity |
Price($) |
Quantity |
|||||
|
2012 |
20 |
10 |
1. |
50 |
25 |
6 |
400.00 |
|||
|
2013 |
22 |
12 |
1 |
60 |
25 |
5 |
425.00 |
|||
We previously calculated that 2013 nominal GDP—output in 2013 valued at 2013 prices—was $442. By contrast, Table 3.3 Real GDP Using 2012 as the Base Year shows that, when valued in year 2012 dollars, the total output of this economy in 2013 is $425. In other words,
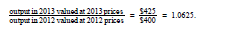
Nominal GDP increased by 10.5 percent between the two years, but real GDP is increased by only 6.25 percent. From this we see that not all of the increase in nominal GDP is due to increased output. Some of the increase is because prices increased between 2012 and 2013.
In our pizza economy, we said that nominal GDP was equal to the price per pizza multiplied by the quantity of pizza. In our example here, we have calculated something very similar. Nominal GDP equals the price level multiplied by real GDP. In the base year, the price level equals 1 (that is what it means to choose the base year), and so real GDP equals nominal GDP in that year. Because we can calculate the increase in the price level and the increase in real
GDP from one year to the next, we can obtain a time series for the price level and a time series for real GDP. In each year, nominal GDP equals the price level in that year times real GDP in that year.
There is, however, one difference between the calculation for our pizza economy and measurement in real economies. In the pizza economy, because there was a single good, we were able to measure real GDP in physical units—the number of pizzas. In real economies, there is no single good, and so we measure real GDP in base year dollars rather than as a physical quantity. The price level in, say, 2013 is not, strictly speaking, the price of real GDP in terms of 2013 dollars but rather is the price of a base year dollar in terms of 2013 dollars.
But this is a technical difference. From an intuitive point of view, it is simplest to think about real GDP as being a physical quantity—a number of pizzas. In this book we therefore imagine that real GDP is actually a bundle of goods and services all melded together to create a composite good. We call that good “units of real GDP,” and we call the price level the price of a unit of GDP. In fact, we could think about the pizza economy in that same way. Even a basic pizza is itself composed of dough, sauce, and cheese: it is a bundle of items melded into one. So when we talk about the physical quantity of pizza, we are really talking about the number of bundles of these ingredients. Likewise, when we talk of real GDP, we are talking about a bundle of goods that we measure in base year dollars. Real GDP is our most basic measure of economic performance. It is a very broad measure because it tells us how much economic activity of any kind (at least, any kind that we can measure) is going on in our economy. Real GDP tells us how much we have produced of all the different goods and services that people enjoy and want to consume. For this reason, real GDP statistics are among the most closely watched of all the figures released by a government.
- 2689 reads
