


In this book, we use price indices that measure the general level of inflation. There are several such measures, but we do not need to worry about this. The differences among these different measures are usually small and typically unimportant for our basic understanding of the economy. The measure of inflation that we have used so far is called the GDP deflator, a price index that uses as the bundle of goods everything that goes into GDP. A more common measure of inflation is the Consumer Price Index (CPI), which uses as the bundle of goods the typical purchases of households.
The CPI is the most familiar measure of prices. When economic commentators speak of inflation, they usually mean the percentage change in the CPI. As the name suggests, the CPI is intended to measure inflation as consumers experience it. The bundle of goods included in the CPI is supposed to correspond to the bundle of goods purchased by a typical household. This means that certain goods that are included in GDP do not show up in the CPI. For example, an increase in the price of stealth bombers does not show up in the CPI because (we hope!) households do not buy stealth bombers. However, stealth bombers do show up in the GDP deflator. At the same time, certain goods that are not part of GDP are included in the CPI—most importantly, consumer goods that are imported from other countries. Because imported goods are not produced in the domestic economy, they do not show up in the GDP deflator; however, because domestic consumers purchase imported goods, they do show up in the CPI.
Households differ dramatically in their consumption patterns, so different households have very different experiences of inflation. An individual who drives 100 miles daily to get to work views variations in the price of gasoline very differently from someone who rides a bicycle to work. The CPI captures the average experience of all households, which can be quite different from the actual experience of an individual household.
Figure 3.8 The Inflation Rate in the United States, 1914–2008 shows the CPI inflation rate (that is, the percentage change of the CPI) from 1914 to 2008 in the United States. 1In some early years, prices actually decreased from one year to the next, meaning that the inflation rate was negative. Since 1960, however, the United States has experienced a positive inflation rate.
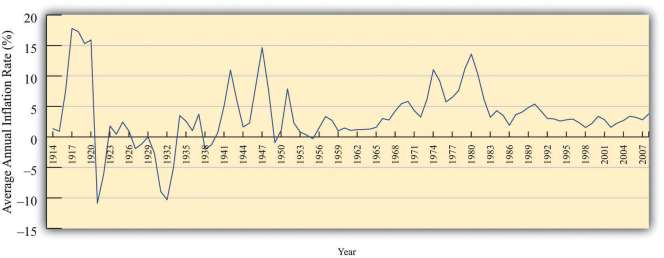
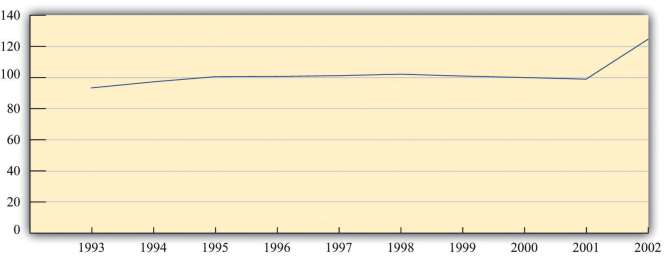
Figure 3.9 The Price Level in Argentina shows the price level in Argentina between 1993 and 2002. The most striking thing about this picture is that there was very little inflation for most of this period. In the final year, however, prices increased substantially. Notice that our picture for the United States shows the inflation rate, whereas for Argentina we are looking at the level of prices. Either way of presenting the data is valid, but it is critical to understand the difference between them. Make sure you understand the difference between the level of prices and the percentage change in prices.
- 1615 reads
