


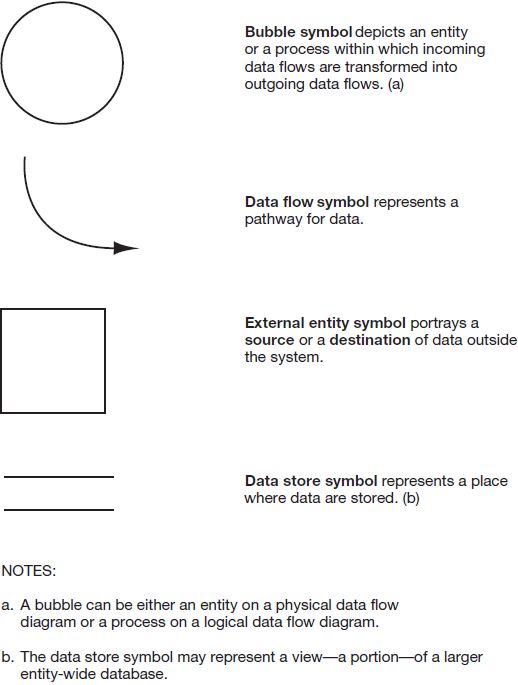
A data flow diagram (DFD) is a graphical representation of a system. A DFD depicts a system’s components, the data flows among the components, and the sources, destinations, and storage of data. Figure 2.1 shows the four symbols used in a DFD.
Context Diagram
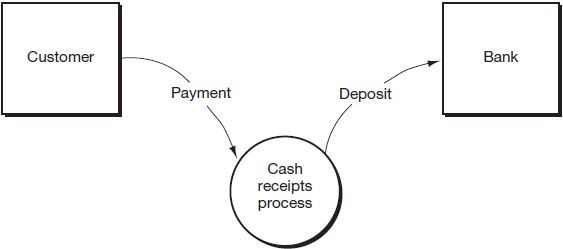
Figure 2.2 is an example of our first type of DFD, the context diagram. A context diagram is a top-level, or least-detailed diagram of an information system. The diagram describes data flows into and out of the system and into and out of external entities. External entities are items such as persons, places, or things outside a system that send data to, or receive data from, a system. 1
Physical Data Flow Diagram
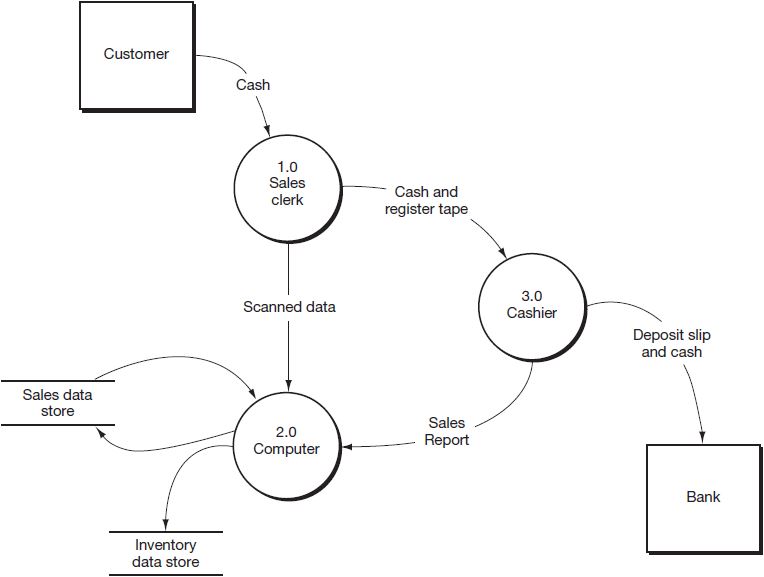
A physical data flow diagram is a graphical representation of a system showing the system’s internal and external entities, and the flows of data into and out of these entities. An internal entity is an entity (i.e., person, place, or thing) within the system that transforms data. 2 Internal entities include, for example, sales clerks (persons), departments (places), and computers (things). Therefore, physical DFDs specify where, how, and by whom a system’s processes are accomplished. A physical DFD does not tell us what is being accomplished, though. For example, in Figure 2.3 we see that the Sales clerk receives cash from the Customer and sends cash, along with a register tape, to the Cashier. So, we see where the cash goes and how the cash receipts data are captured on the register tape, but we don’t know exactly what was done by the Sales clerk.
Notice that the physical DFD’s bubbles are labeled with nouns and that the data flows are labeled to indicate how data are transmitted between bubbles. For example, the Sales clerk sends cash and a register tape to the Cashier. Also, see that a data store’s location indicates exactly where (in the Computer) and a data store’s label indicates how (in the sales data store) a system maintains sales records. Finally, while the entity boxes on the context diagram define external entities in the relevant environment, the bubbles in the physical DFD define internal entities.
|
Review Question What is a physical data flow diagram (DFD)? |
Logical Data Flow Diagram
A logical data flow diagram is a graphical representation of a system showing the system’s processes and the flows of data into and out of the processes. We use logical DFDs to document information systems because we can represent the logical nature of a system—what tasks the system is doing—without having to specify how, where, or by whom the tasks are accomplished. What a system is doing will change less over time than will how it is doing it. For example, a cash receipts system will typically receive customer payments and post them to the customer’s account. Over time, however, the form of the payment—cash, check, electronic funds—and the method of recording—manual, computer—may change.
|
Review Question What is a logical data flow diagram (DFD)? |
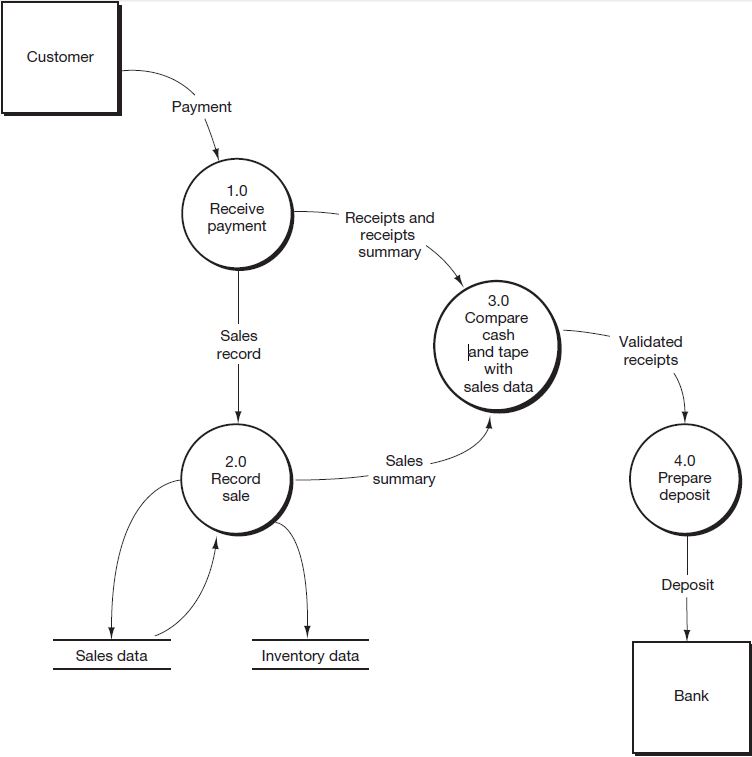
The advantage of a logical DFD (versus a physical DFD) is that we can concentrate on the functions that a system performs. See, for example, Figure 2.4, where the labels on the data flows describe the nature of the data, rather than how the data are transmitted. Is the “payment” in the form of a check, cash, credit card, or debit card? We don’t know. Is “Sales data” a book, card, or records stored on a computer? Again, we don’t know. What we do know is that customer payments are received, recorded in a sales data store, verified for accuracy, and deposited in the bank. So, a logical DFD portrays a system’s activities, while a physical DFD depicts a system’s infrastructure. We need both pictures to understand a system completely.
|
Review Question Describe the symbols used in constructing data flow diagrams. |
Finally, note that the processes in Figure 2.4 are labeled with verbs that describe the actions being performed, rather than with the nouns we saw in the physical DFD.
Figure 2.4 is a top-level view of the single bubble in Figure 2.2, the context diagram. Because all of the bubbles in Figure 2.4 are numbers followed by a decimal point and a zero, this diagram is often called a “level 0” diagram. 3 You should notice that each of the data flows into and out of the context bubble in Figure 2.2 also flow into and out of the bubbles in Figure 2.4 (except for the flows between bubbles, such as “Sales record,” which were contained within the bubble in Figure 2.2). When two DFDs—in this case, the context and the level 0—have equivalent external data flows, we say that the DFDs are balanced. Only balanced sets of DFDs (that is, a context diagram, a logical DFD, and a physical DFD) are correct.
To derive Figure 2.4, we have “exploded” the context diagram in Figure 2.2 into its top-level components. We have looked inside the context diagram bubble to see the major subdivisions of the Cash receipts process. The successive subdividing, or “exploding,” of logical DFDs is called top-down partitioning and, when properly performed, leads to a set of balanced DFDs.
We will use Figure 2.5, which depicts a generic set of balanced DFDs, to study partitioning and balancing. Notice that the level 0 DFD (part b) has the same input “A” and the same output “B” as the context diagram (part a). Now look at part c, an explosion of bubble 1.0. Part c has the same input “A” and the same outputs “C” and “D” as part b. This relationship must exist because diagram 1.0 (part c) is an explosion of bubble 1.0 in part b. The same can be said for part d, the partitioning of bubble 3.0. Finally, part e shows diagram 3.1, a partitioning of bubble 3.1 in part d. Study Figure 2.5 to make sure you understand the relationships among levels in this set of DFDs. While you are studying the figure, you might also notice the convention used to number the bubbles at each level. Also, see that the entity boxes appear in the context diagram and the level 0 diagram but do not usually appear in diagrams below the level 0.
|
Review Question What is the difference between a context diagram, a logical DFD, and a physical DFD? |
- 27596 reads
