


|
Review Question Distinguish the aspects of systems depicted by DFDs from those depicted by E-R diagrams. |
As a professional you will likely be performing one or more of four functions. You might be (1) a business process owner; (2) a designer of an IS; (3) an IS user; or (4) an evaluator of an IS. To effectively perform these roles, you must be aware of the procedures used to develop and install an IS. Systems development procedures include two concurrent and often inseparable processes: the development of the system procedures and the design of the database. DFDs often portray system procedures, and entity-relationship diagrams often depict specifications for the database.
As you will see in Chapter 3, a data model depicts user requirements for data in the database. The model is expressed as a structure of entities and relationships among those entities. Figure 2.9 depicts a data model expressed as an entity-relationship diagram. An entity-relationship diagram (also called an E-R diagram) reflects the system’s key entities and the relationships among those entities and is commonly used to represent a data model. The rectangles are called “entities” and the diamonds are called “relationships.” We use the E-R diagram because it helps us develop a logical model of the data—the entities and relationships—in a way that is independent of the way that we will physically implement the database.8
|
Review Question What is an E-R diagram? |
Let’s see how to read an E-R diagram. The diamond (i.e., relationship) on the left side of the diagram tells us that an order is received from a customer. The formal notation is ORDER received from CUSTOMER. We might be confused by the diagram and want to say “CUSTOMER received from ORDER.” But we can usually interpret the diagram correctly by knowing the sense of the relationship.
In Figure 2.9, the “N” beneath the ORDER rectangle tells us that each customer may have more than one order; the “1” above the CUSTOMER rectangle tells us that each order is from only 1 customer. This, the first of three relationship categories, is called “one-to-N,’’ and the notation is 1:N(or “N-to-one” and noted as N:1).
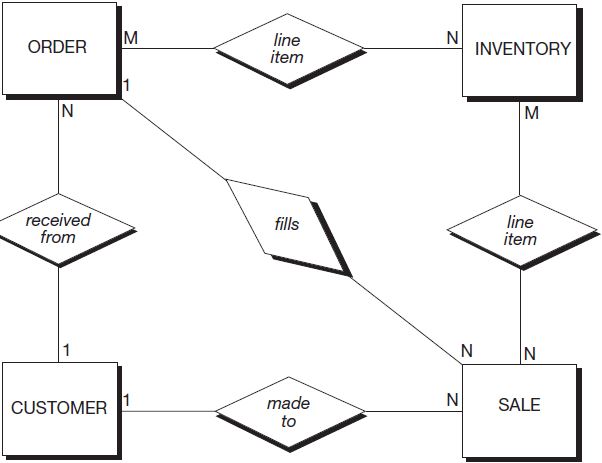
The second relationship category is called “M-to-N,” and the notation is M:N. In Figure 2.9, we see that each INVENTORY item has many ORDERs, and each ORDER has many INVENTORY items (a many-to-many relationship). Figure 2.9 also tells us that there are many SALES (shipments) for each INVENTORY item and that each SALE (shipment) can consist of many line items of inventory.
There is a third relationship category, called “one-to-one,” and it uses the notation 1:1. If, in Figure 2.9, only one SALE (shipment) filled an ORDER, there would be a 1:1 relationship between ORDER and SALE. In Chapter 3, we explore how to prepare an E-R diagram.
|
Review Question Describe the symbols used in constructing E-R diagrams. |
- 10454 reads
