


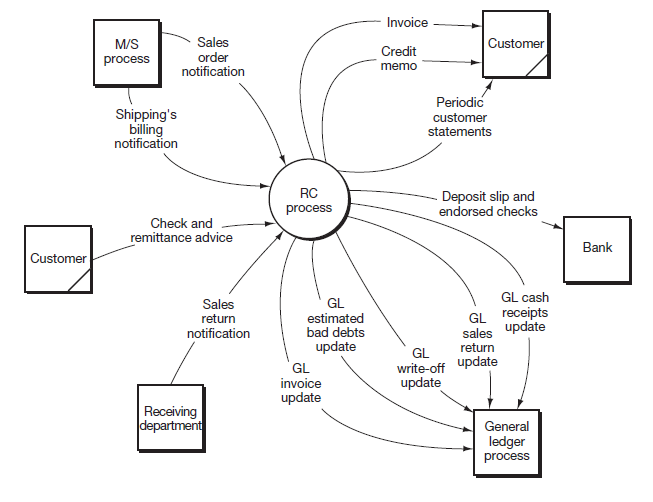
As you learned in Documenting Business Processes and Information Systems and saw applied in THE “ORDER-TO-CASH” PROCESS: PART I, MARKETING AND SALES (M/S), our first view of the process is a general one, shown in the form of a context diagram. For the RC process, that view appears in Figure 12.3. Note the external entities with which this process interacts and the data flows running to and from those entities.
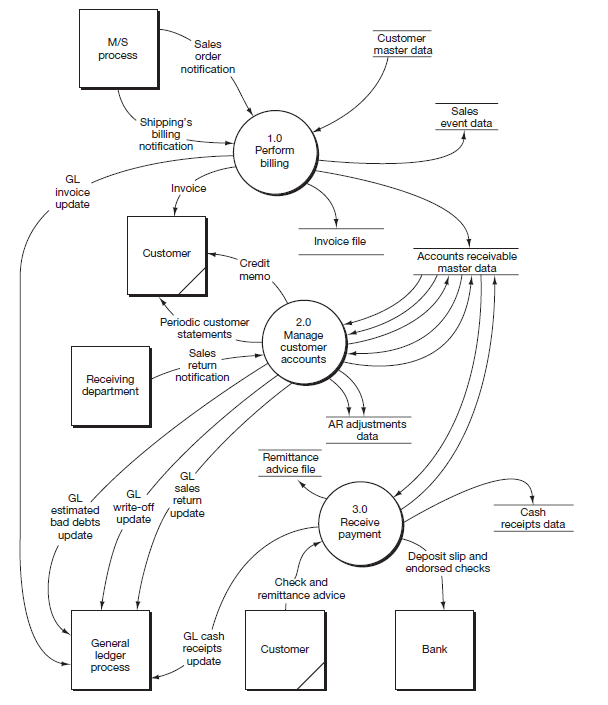
Now let’s explode Figure 12.3 into the level 0 diagram reflected in Figure 12.4. In this expanded view of the process, we see that the single bubble in Figure 12.3 has become three process bubbles. We also see the event and master data for this process. At this point, review Figure 12.4 and compare it to Figure 12.3 to confirm that the two figures are “in balance” with each other. Each of the three process bubbles shown in the level 0 diagram are decomposed into their lower-level diagrams in Appendix 11A.
In the section “Logical Data Descriptions” that follows later in the chapter, we define or explain the accounts receivable master data, sales event data, and invoice data.Before proceeding, let’s take a brief look at the information content of an invoice. Figure 12.5 is an example of a sales order inquiry of invoice items.

The invoice is a business document used by a vendor to notify the customer of an obligation to pay the seller for the merchandise ordered and shipped. Notice that the information at the top of the screen represents that part that would be printed to an invoice to identify the unique order placed and associated with a specific customer. The body of the screen captures the item or items ordered by the customer and the related pricing information. When the invoice is printed, it may often include the payment details.
- 9636 reads
