


A systems flowchart is a graphical representation of information processes (activities, logic flows, inputs, outputs, and data storage), as well as the related operations processes(entities, physical flows, and operations activities). Including both manual and computer activities, the systems flowchart presents a logical and physical rendering of the who, what, how, and where of business processes and Information Systems.
Systems flowcharts can be complex and cumbersome when they depict a large or complicated process. DFDs can be drawn at many levels of complexity, so someone needing only a high level view or a picture of only a part of the process doesn’t need to work through the complexities of a systems flowchart. However, for detailed analysis of business processes, the complexity of a systems flowchart is invaluable.
|
Review Question What is a systems flowchart? |
By combining the physical and logical aspects of a system, the systems flowchart gives us a complete picture of a system. Physical and logical DFDs each depict different aspects of a system. In addition, the systems flowchart includes the business process and management context for a system, aspects ignored in DFDs. Like DFDs, systems flowcharts represent a system to identify parts that could be improved or streamlined, and to analyze a system’s controls. Taken together, DFDs and flowcharts provide multiple, complementary methods for describing a system.
|
Review Question What are the similarities and differences between a systems flowchart and a DFD? |
Systems Flowcharting Symbols
Figure 2.6 shows systems flowcharting symbols used in this textbook. This is a limited set to illustrate flowcharting principles. Use this set as a key to interpreting later diagrams.
Common Systems Flowcharting Routines
Figure 2.7 Figure 2.8 contains routines often found on systems flowcharts. Follow along with us as we describe each of these routines.
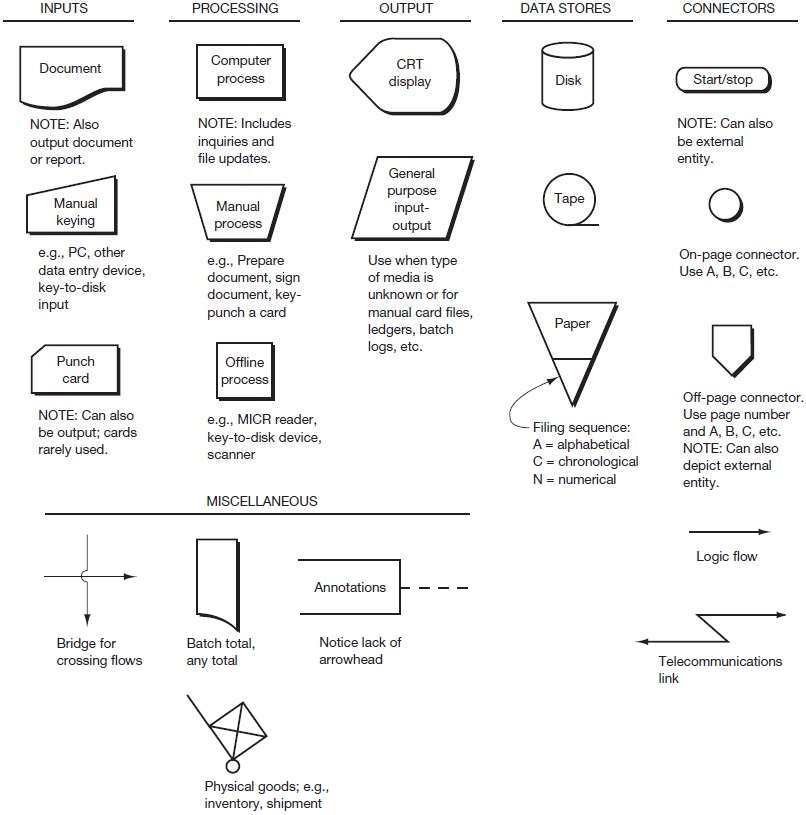
Figure 2.7, part (a), depicts a typical two-step data entry process which might be described as follows:
The data entry clerk (such as a telephone sales clerk) keys a sales input document while online. The computer accesses data in data store 1 (perhaps a table of valid codes, such as customer codes) and in data store 2 (perhaps a table of open sales orders) to edit/validate the input. The computer displays the input, including any errors. The clerk compares the input document to the display, keys in corrections as necessary, and accepts the input. The computer updates the table in data store 2 and notifies the clerk that the input has been recorded.
Notice the following about Figure 2.7, part (a):
- The edit or validate step may be performed with one or more data stores.
- The display is implied with most, if not all, data entry processes.
- By combining the “Edit/validate input” rectangle with the “Record input” rectangle, we could depict this input process in one—rather than two—steps without losing much detail about the activities being performed.
- The manual processes undertaken by the clerk are isolated in a separate column to distinguish them from the automated processes undertaken by the computer.
- We show the input document at the bottom of the column to indicate that the document “flows” through the input process.
Figure 2.7, part (b), depicts a typical online computer query, which might be described as follows:
A user keys a query request online into a computer. The computer accesses the table(s) in one or more data stores and presents a response to the user.
Notice the following about Figure 2.7, part (b):
- The user and computer activities are again isolated in separate columns.
- The display is an implied element of the online computer.
Figure 2.7, part (c), depicts the update of master data stored in a sequential data store and might be described as follows:
New data (a customer address change, for example) previously recorded on disk are input to the computer, along with the existing (old) master data (customer master data, for example). The computer updates the existing master data and creates a new version of the master data.
Notice the following about Figure 2.7, part (c):
- When sequential master data is updated, we show two data store symbols on a flowchart. One symbol represents the existing (old) version and the other represents the new version.
- A dashed line connects the new with the old master data version to show that the new becomes the old version during the next update process.
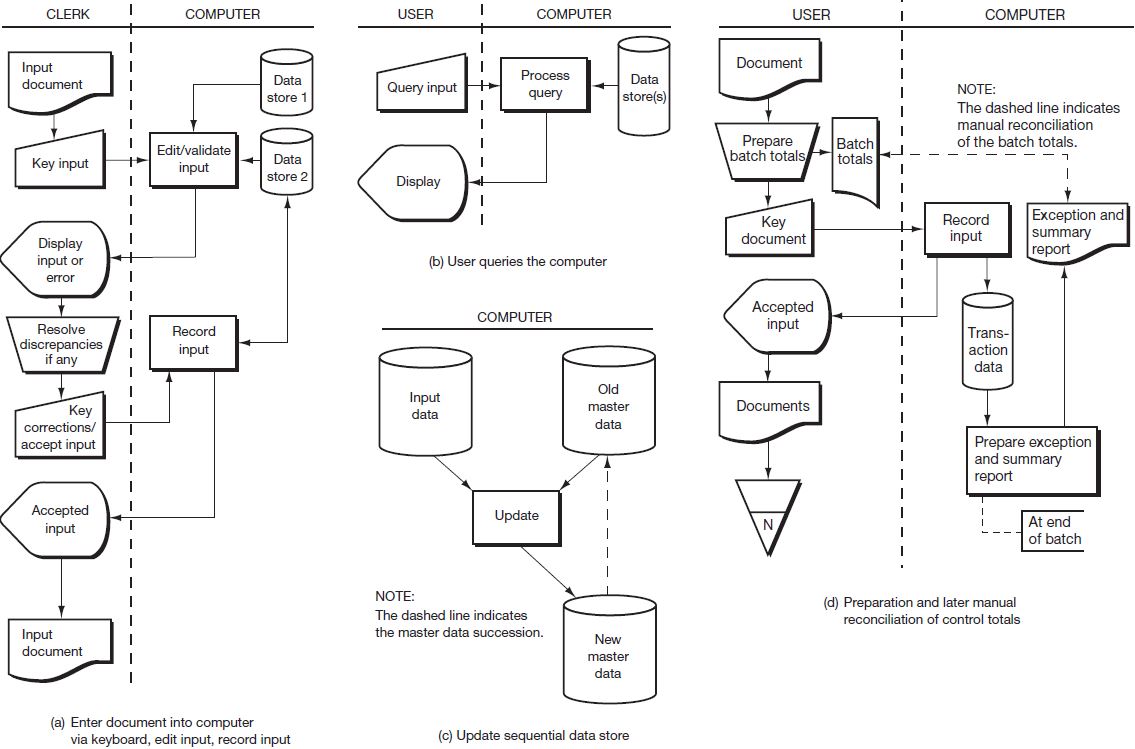
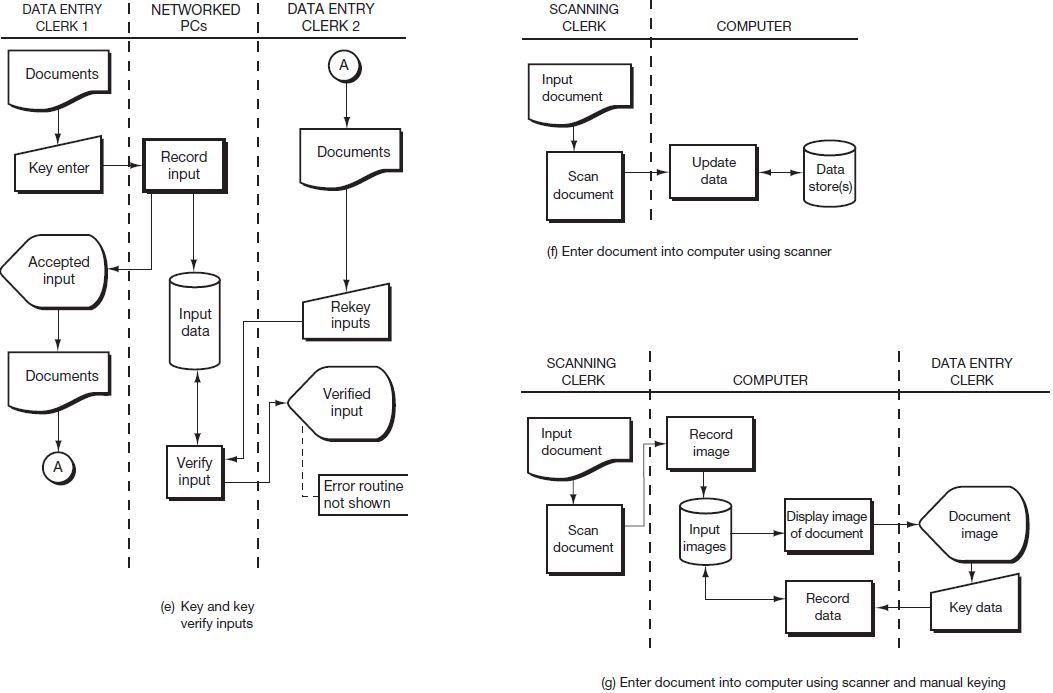
Figure 2.7, part (d), depicts the input and reconciliation of computer inputs and might be described as follows:
The user collects a number of input documents in a “batch” (such as a week’s worth of time cards), prepares batch totals, and enters the documents into the computer. The computer records the inputs on a disk and notifies the user as each input is accepted. The user files the input documents in numerical sequence. At the end of the batch, the computer prepares an exception and summary report (a list of inputs accepted and rejected by the system) that includes batch totals. The user compares the computer batch totals to those prepared prior to entry of the documents to make sure the data were entered correctly.
Notice the following about Figure 2.7, part (d):
- The annotation makes it clear that the computer prepares the exception and summary report after the user has completed entry of the batch.
- The user’s comparison of the batch totals is depicted with a dashed line—rather than a manual process.
- If the batch totals had been input with the batch, the computer—rather than the user—could compare the batch totals.
Figure 2.7, part (e), depicts entry of data to a data entry system and might be described as follows:
A data entry clerk (perhaps clerk 1) enters documents into a PC (client) connected to a data entry system. The system records the inputs on a disk and notifies the user of the acceptance of each input. The documents are then forwarded to a different clerk (say clerk 2) who keys the documents again. 1 Differences are resolved and the transaction data are updated to reflect the verifications and corrections.
Notice the following about Figure 2.7, part (e):
- The key-to-disk unit is an offline device and should be depicted with a square—rather than a rectangle—and in a column separate from the computer.
- We show the data entry clerks in two columns to emphasize that the keying and two different clerks perform verification steps.
- Clerk 2 probably follows an established procedure to reconcile differences found during the verification step. We use the annotation about error routine to suggest the existence of these procedures.
Figure 2.7, part (f), depicts the entry and recording of an input using a scanner and might be described as follows:
A clerk scans a document (e.g., a customer’s billing stub) into the computer. Using the data from the scanned document, the computer updates the data located on one or more data stores.
Notice the following about Figure 2.7, part (f):
- We represent the scanner with the offline process symbol.
- We could include a display coming from the scanner, showing the clerk the document that had just been scanned.
- To be able to read data from the document, the scanner must have optical character recognition (OCR) capabilities.7
Figure 2.7, part (g), depicts the entry and recording of an input using a scanner and a keyboard and might be described as follows:
A clerk scans a document into the computer. The computer routes an image of the scanned input to a data entry clerk, who keys data from the document’s image into the computer. The computer records the keyed data with the scanned document.
You should quickly become reasonably proficient in reading flowcharts if you learn these routines. You may encounter many different flowcharting methods during your career, but the principles you learn here will carry over to those techniques.
- 12776 reads
