


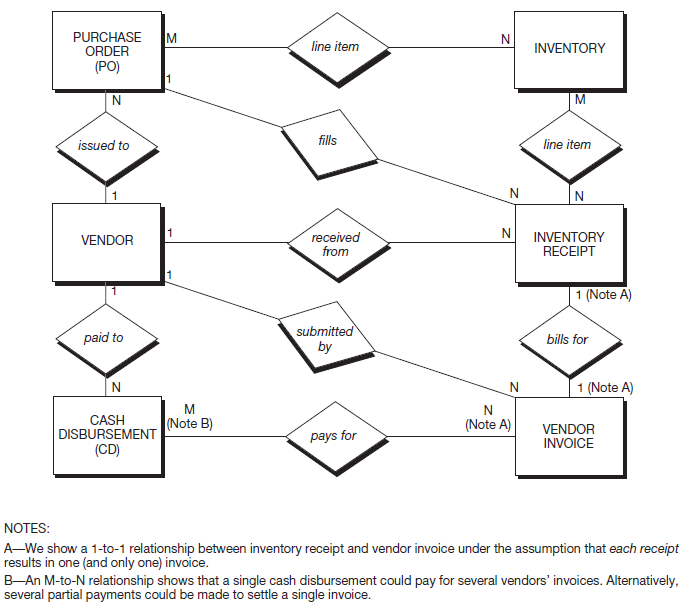
As in the prior two chapters, this section focuses on a database approach to data management. In Figure 13.17, we first portray the data model for the PtoP process in an entity-relationship (E-R) diagram.
In examining the figure, you’ll notice that the events of preparing purchase orders, receiving merchandise, recording vendor invoices, and paying those invoices are depicted by four of the entity boxes. The other two entities reflect how these four events relate to an agent (VENDOR) and to a resource (INVENTORY). To simplify the figure, we have:
- Ignored the event of preparing the purchase requisition.
- Assumed that all purchase orders are for merchandise inventory items (i.e., purchases of other goods and services are ignored).
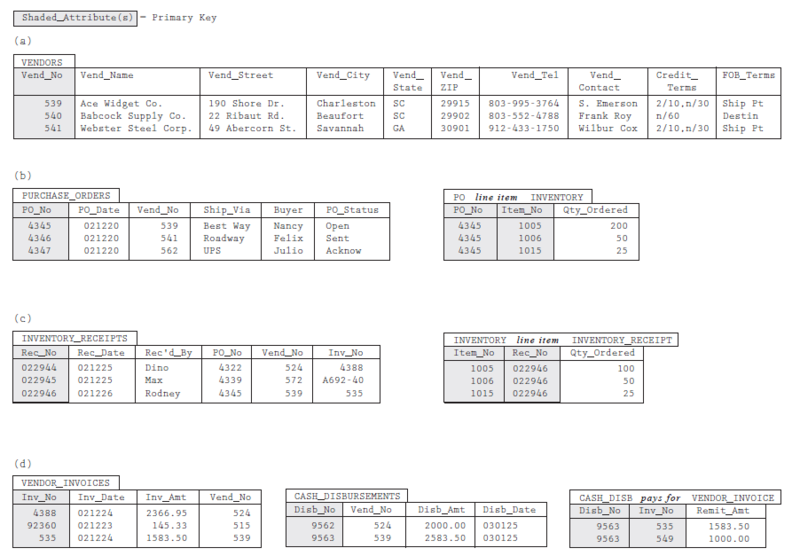
From Figure 13.17, we move to the relational tables shown in Figure 13.18. Note that the relations in Figure 13.18 are similar to those shown in Figure 13.18 and Figure 12.16 (e.g., VENDORS is similar to CUSTOMERS, PURCHASE_ORDERS resembles SALES_ORDERS, PO line item INVENTORY is like SALES_ORDER line item INVENTORY, and so forth).
- 3063 reads
