


|
Review Question What is a table of entities and activities? |
Our first step is to create a table of entities and activities. In the long run, this list will lead to quicker and more accurate preparation of DFDs and a systems flowchart because it clarifies the information contained in a narrative and helps us to document the system correctly.
To begin your table, go through the narrative line-by-line and circle each activity being performed. An activity is any action being performed by an internal entity or an external entity. Activities can include actions related to data (originate, transform, file, or receive) or to a business process. Business process activities might include picking goods in the warehouse, inspecting goods at the receiving dock, or counting cash. For each activity there must be an entity that performs the activity. As you circle each activity, put a box around the entity that performs the activity.
Now you are ready to prepare your table. List each activity in the order that it isperformed, regardless of the sequence in which it appears in the narrative. List the activity, along with the name of the entity that performs the activity and the paragraph number indicating the location of the activity in the narrative. After you have listed all activities, consecutively number each activity.
Compare your table to Table 2.1. Notice that the narrative refers to some entities in more than one way. For example, we have “accounts receivable” and the “clerk” on line 16. Notice that we listed both activity 7 and activity 8. It might be that activity 7 describes activity 8 and does not need to be listed itself. However, it is better to list doubtful activities than to miss an activity. See how we listed activity 11, found on lines 23 and 24. We changed to the active form of the verb “notify” so that we could show the activity next to the entity that performs the action. Before continuing, resolve any differences between your list of entities and activities and those in Table 2.1.
Drawing the Context Diagram
We are now ready to draw the context diagram. Since a context diagram consists of only one circle, we can begin our context diagram by drawing one circle in the center of our paper. Next, we must draw the external entity boxes. To do this, we must decide which of the entities in Table 2.1 are external and which are internal to the system.
DFD guideline 1:
Include within the system context (bubble) any entity that performs one or more information processing activities.
Information processing activities are those activities that retrieve data from storage, transform data, or file data. Information processing activities include document preparation, data entry, verification, classification, arrangement or sorting, calculation, summarization, and filing—both manual and automated. The sending and receiving of data between entities are not information processing activities because they do not transform data. If we send data to another entity, we do not process data. If, however, we file data, we do perform an information processing activity. Likewise, if we receive data from another entity, we do not perform an information processing activity. But, if we retrieve data from a file or table, we do perform an information processing activity. Operational, or physical, business process activities are not information processing activities.
| Entities | Para | Activities |
| Customers | 1 | 1. Send checks and remittance advices. |
| Mailroom (clerk) | 1 | 2. Endorses checks. |
| Mailroom (clerk) | 1 | 3. Writes the amount paid and the check number on the remittance advice. |
| Mailroom (clerk) | 1 | 4. Prepares a batch total of the remittance advices. |
| Mailroom (clerk) | 1 | 5. Sends the batch of remittance advices and the batch total to the accounts receivable clerk. |
| Mailroom (clerk) | 1 | 6. Sends the batch of checks to the cashier. |
| Accounts receivable (clerk) | 2 | 7. Enters the batch into the computer. |
| Accounts receivable (clerk) | 2 | 8. Keys the batch total, the customer number, the invoice number, the amount paid, and the check number. |
| Computer | 2 | 9. Verifies that the invoice is open and that the correct amount is being paid. |
| Computer | 2 | 10. Updates the accounts receivable master data. |
| Computer | 2 | 11. Notifies the clerk of errors. |
| Computer | 4 | 12. Logs check number and amount paid. |
| Computer | 3 | 13. Prints a deposit slip. |
| Cashier | 3 | 14. Compares the deposit slip with the batch of checks. |
| Cashier | 3 | 15. Takes the deposit to the bank. |
| Computer | 4 | 16. Creates a cash receipts listing. |
| Computer | 4 | 17. Prints a summary of customer accounts paid. |
| Accounts receivable (clerk) | 4 | 18. Compares the computer reports with the remittance advices and batch totals. |
| Accounts receivable (clerk) | 4 | 19. Sends the total of cash receipts to the general ledger office. |
To discover which entities perform no information processing activities, we must inspect the table of entities and activities and mark those activities that are not information processing activities. Any entities that do not perform any information processing activities will be external entities; the remaining entities will be internal. Go through your table of entities and activities and mark all the activities that do not perform information processing activities. These marked activities—mostly sends and receives—indicate data flows.
|
Review Question Which entities in a narrative are included in the context diagram as internal and which are shown as external? |
At first, you should have indicated activities 1, 5, 6, 15, and 19 because these activities only send or receive data. As we mentioned earlier, activity 7 only describes activity 8 and can be marked. Finally, activity 11 can be marked because of the following guideline:
DFD guideline 2:
For now, include only normal processing routines, not exception routines or error routines, on context diagrams, physical DFDs, and level 0 logical DFDs.
Since activity 11 occurs only when the payment data contain an error, we will not consider this activity for now.
Your table of entities and activities, with certain non-information processing activities marked, should now indicate that the mailroom, accounts receivable, the cashier, and the computer perform information processing activities and will be included in our diagrams as internal entities. The customer, on the other hand, does not perform any such activities and is an external entity.
Are there other external entities to be included in our diagrams? To answer this question, go through the narrative one more time and put a box around those entities not yet marked. You should find the bank (line 30) and the general ledger office (line 40) that, in this system, do not perform information processing activities. These entities, along with the customer, are external entities and are included in the context diagram as sources or destinations of data. We now have three external entities, four internal entities, and 19 activities. No other entities or activities are to be addedbecause of the following guideline:
DFD guideline 3:
Include on the systems documentation all (and only) activities and entities described in the system narrative—no more, no less.
When we say narrative, we are talking about the narratives that you will find as problem material in this book. You are to assume, in those cases, that the narrative is complete and accurate. However, when you prepare a narrative to document a real-world case, you cannot assume that your narrative is perfect. It should be reviewed and revised by working with all participating internal entity representatives. When you have verified that your narrative is complete and that it accurately reflects reality, you must then follow DFD guideline 3.
|
Review Question When do we have a choice as to what will be included in a context diagram? |
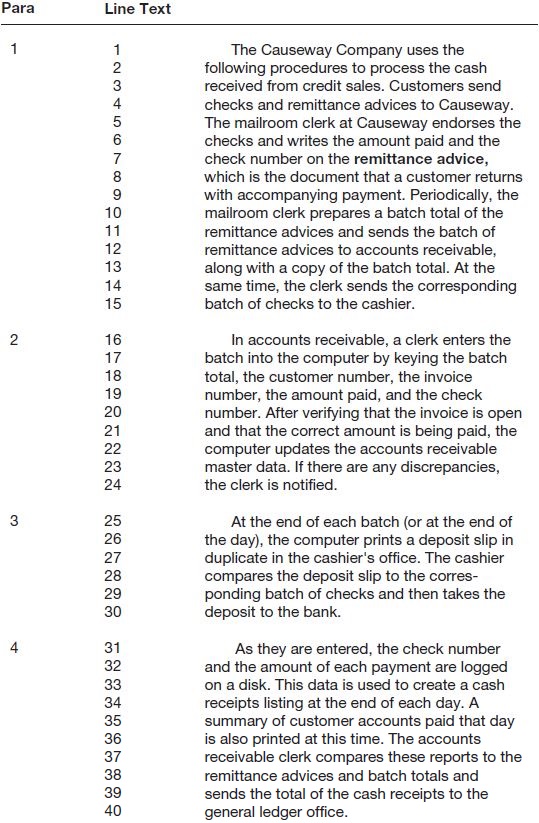
Because there are three entities external to the Causeway cash receipts system—the customer, the bank, and the general ledger office—you must draw three boxes surrounding the one context bubble. Next, draw and label the data flows that connect the external entities with the bubble. Because logical (versus physical) labels are usually used on a context diagram, you should do your best to derive logical labels for the flows. The final step is to label the context bubble. Write a descriptive label that encompasses the processing taking place within the system. Our label in Figure 2.11 indicates the scope of the Causeway system—namely, cash receipts from charge customers. The Causeway system does not include cash receipts from any other source.
Figure 2.11 is the completed Causeway context diagram. Compare it to your context diagram, and resolve any differences. Notice that we include a single square for many customers. Likewise, although we may use several banks, we have a single Bank square. The following guideline applies:
DFD guideline 4:
When multiple entities operate identically, depict only one to represent all.
Drawing the Current Physical Data Flow Diagram
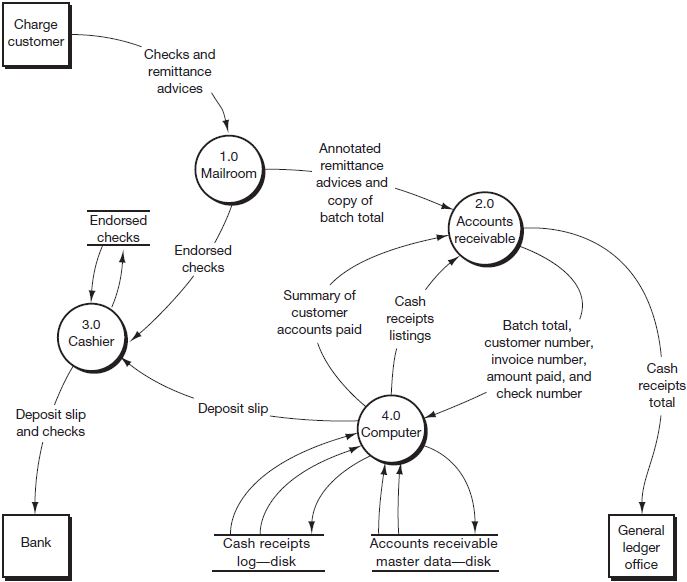
To keep the current physical DFD balanced with the context diagram, start a current physical DFD by drawing the three external entities from the context diagram near the edges of a piece of paper. Next, draw and label each data flow going into the two destinations and coming out of the single source. Leave the center of the page, into which we will sketch the rest of the diagram, as open as possible. As this is a physical DFD, the data flows should have labels that describe the means by which the flow is accomplished. For example, the “Payment” from the customer should now be labeled “Checks and remittance advices,” and the “Deposit” should now be labeled “Deposit slip and checks.”
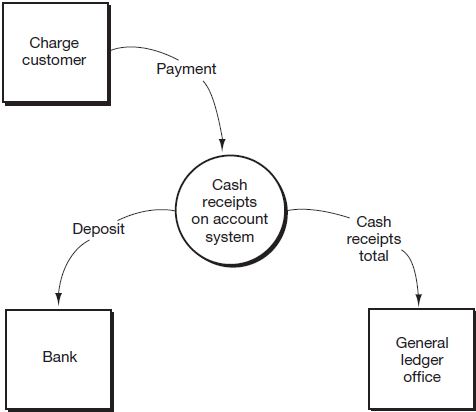
Because each internal entity listed in the table of entities and activities (Table 2.1) becomes a bubble in our physical DFD, we know that our current physical DFD will contain four bubbles: one each for the mailroom, the cashier, accounts receivable, and the computer. We will start adding these four bubbles by first drawing the bubbles on our diagram that are connected to the sources and destinations. During this process, you must consider all “send” and “receive” activities and the implied reciprocal activities. (Many of these were marked earlier to indicate that they were not data processing activities.) For example, activity 1 indicates that the customer “sends” the checks and remittance advices. Draw and label a mailroom bubble, an accounts receivable bubble, and a cashier bubble. Use a data flow to connect each of these three bubbles to its related external entity.
To complete the physical DFD, we must go through the table of entities and activities once again and draw all the remaining entities and flows. Activity 5 indicates a connection between the mailroom and accounts receivable. Activity 6 indicates a connection between the mailroom and the cashier. Activity 8 tells us that the accounts receivable clerk enters data into the computer. Draw the computer bubble, label it “4.0,” and connect it to accounts receivable. To perform activity 18, accounts receivable must receive the reports from the computer. Draw and label one or two flows (we chose two flows) from the computer to accounts receivable. To perform activity 14, the cashier must receive the deposit slip from the computer. Activity 16 implies that the table of accounts receivable master data must be read so that the open invoice record can be retrieved. Draw the data store for the accounts receivable master table and a flow from the data store to the computer bubble. Notice that the label on the data store shows that the physical storage medium is a disk. We draw a flow only from the data store because a data request is not a flow of data. Therefore, we do not show the request for the open invoice record. The movement of the record out of the data store in response to this request is a flow of data and is shown. Also, notice that we did not show a flow from the accounts receivable data store directly to the accounts receivable bubble. Because the accounts receivable data store is on a computer disk, only the computer can read from or write to that disk. This also excludes any direct connection between computerized data stores. To update the data on one computerized data store from another, you must go through a computer bubble.
Because the open invoice record must be read into the computer, updated, and then written back to the accounts receivable master table, activity 10 requires a data flow from and to the accounts receivable data store. But, since we drew a flow from the data store for activity 9, we need only draw a flow back to the data store. Activity 12 requires that we draw a data store for the cash receipts log and that we draw a data flow from the computer into that data store, whereas activity 13 requires that we draw a flow from the data store. Finally, to depict the flow of data required to print the reports indicated in activities 16 and 17, we need to draw flows from both data stores into the computer. You may think that all the flows into and out of the data stores aren’t necessary. Here is a guideline:
DFD guideline 5:
For clarity, draw a data flow for each flow into and out of a data store. You may, also for clarity and to help you determine that you have included all necessary flows, label each flow with the activity number that gives rise to the flow or with a description of the flow (e.g., “retrieve accounts receivable master data”).
Figure 2.12 is the completed Causeway current physical DFD. Compare it to your diagram and, before continuing, resolve any differences. You should notice that there is a data store of endorsed checks connected to the cashier. This file, not mentioned in the narrative, was added to show that the cashier must hold on to batches of checks until the deposit slip is printed on the computer terminal. This format leads to another guideline:
DFD guideline 6:
If a data store is logically necessary (that is, because of a delay between processes), include a data store in the diagrams, whether or not it is mentioned in the narrative.
Should we draw a data store to show that the remittance advice batches and batch totals are retained in accounts receivable until the computer reports are received? We could. You must use DFD guideline 6 carefully, however, so that you don’t draw DFDs that are cluttered with files and are therefore difficult to read. You need to use your judgment. Does this guideline contradict DFD guideline 3? No. DFD guideline 3 tells you to include in your diagrams only those activities included in your narrative; while DFD guideline 6 tells you to describe those activities completely. So, if the narrative implies an activity or data store, include it in the diagrams. How about an example that would violate DFD guideline 6? Because they are outside the context of this particular system, the following activities are not described in the narrative (Figure 2.10) and should not be included in the diagrams:
- The actual update of the general ledger data
- Cash receipts from cash sales
- Customer billing
|
Review Question Which activities can be included in the logical process on a logical DFD? |
Drawing the Current Logical Data Flow Diagram
The current logical DFD portrays the logical activities performed within the system. Because level 0 DFDs depict a particular grouping of the logical activities, we start the level 0 DFD by enumerating the activities in the system; then, we group those activities. You already have a list of the activities to be included in the level 0 DFD. Do you know what that list is? The activities to be included in the level 0 DFD are the unmarked activities on the table of entities and activities, Table 2.1. Our list includes activities 2, 3, 4, 8, 9, 10, 12, 13, 14, 16, 17, and 18. Recall that, at this time, we don’t consider any other activities because the other activities either are actions performed in other-than-normal situations, are actions that merely send or receive data rather than transform data, or are business process activities, such as picking goods off the shelf. Several guidelines will help us to group the activities remaining in our list:
DFD guideline 7:
Group activities if they occur in the same place and at the same time. For example, the clerk performs activities 2 and 3 in the mailroom as each payment is received.
|
Review Question What are the guidelines for grouping logical activities for a logical DFD? |
DFD guideline 8:
Group activities if they occur at the same time but in different places. For example, the cashier performs activity 14 “immediately” after the computer prints the deposit slip in activity 13.
DFD guideline 9:
Group activities that seem to be logically related.
DFD guideline 10:
To make the DFD readable, use between five and seven bubbles. 1
To start preparing your logical DFD, try bracketing the activities in Table 2.1 as you believe they should be grouped (do not consider the marked activities). For example, if we apply DFD guideline 7 (that is, same time and same place), we could combine activities 2 and 3; activities 9, 10, and 12; and activities 16 and 17. Although this would provide a satisfactory solution, there would be eight bubbles, and there would be several bubbles containing only one activity. Since we prefer not to have too many single activity bubbles until we get to the lowest-level DFDs, we proceed with further groupings.
If we apply DFD guideline 8 (that is, same time but different place) to the preceding grouping, we could combine activities 8 with 9, 10, and 12; 13 with 14; and 16 and 17 with 18. This solution is also fine, and is a little better than our first solution because we now have five bubbles and we have only one single-activity bubble.
If we apply DFD guideline 9 (that is, logically related activities), we can combine activities 2, 3, and 4. Although this leaves us with only four bubbles, this solution is superior to the first two because we have no single-activity bubbles.
In summary, our groups are:
- Group 1: activities 2, 3, 4
- Group 2: activities 8, 9, 10, 12
- Group 3: activities 13, 14
- Group 4: activities 16, 17, 18
After we choose our groupings, we must give each group a name that describes the logical activities within the group. For Causeway, we chose the following labels:
- Group 1 (activities 2, 3, 4) is bubble 1.0 and is labeled “Capture cash receipts” because that bubble comprises all the activities after the payment is sent by the customer until the payment is keyed into the computer.
- Group 2 (activities 8, 9, 10, 12) is bubble 2.0 and is labeled “Record customer collections” because the activities in bubble 2.0 record the payment in the cash receipts transaction table and the accounts receivable master table.
- Group 3 (activities 13 and 14) is bubble 3.0 and is labeled “Prepare deposit” because the activities generate a deposit slip and send the deposit to the bank.
- Group 4 (activities 16, 17, 18) is bubble 4.0 and is labeled “Prepare cash receipts total” because that is the main purpose of the reporting and comparison that takes place.
| Entities | Para | Activities | |
| Mailroom (clerk) | 1 | 2. Endorses checks. | 1.0 Capture cash receipts |
| 1 | 3. Writes the amount paid and the check number on the remittance advice. | ||
| 1 | 4. Prepares a batch total of the remittance advices. | ||
| -------------------------------------------------------------------------------------- | |||
| Accounts receivable (clerk) | 2 | 8. Keys the batch total, the customer number, the invoice number, the amount paid, and the check number. | 2.0 Record customer collections |
| 2 | 9. Verifies that the invoice is open and that the correct amount is being paid. | ||
| Computer (online terminal) | 2 | 10. Updates the accounts receivable master data. | |
| 4 | 12. Logs check number & amount paid. | ||
| -------------------------------------------------------------------------------------- | |||
| Computer (online terminal) | 3 | 13. Prints a deposit slip. | 3.0 Prepare deposit checks |
| Cashier | 3 | 14. Compares the deposit slip with the batch of | |
| -------------------------------------------------------------------------------------- | |||
| Computer (online terminal) | 4 | 16. Creates a cash receipts listing. | 4.0 Prepare cash receipts total |
| 4 | 17. Prints a summary of customer accounts paid. | ||
| Accounts receivable (clerk) | 4 | 18. Compares the computer reports with remittance advices and batch totals. | |
Mark these groups and labels on Table 2.1.
Table 2.2 demonstrates how you should annotate your table of entities and activities. (Notice that we have not carried forward from Table 2.1 the marked activities.) Now draw the current logical DFD for Causeway. You’ll need paper and pencil (or your computer), the Causeway context diagram (Figure 2.11), the Causeway current physical DFD (Figure 2.12), your annotated table of entities and activities (Table 2.2), and your original table of entities and activities (Table 2.1). To draw the logical DFD, begin in the same manner that you began to draw the current physical DFD. Draw the external entities near the edges of a piece of paper. Draw and label flows to and from the external entities, while leaving the center of the page blank to receive the remainder of the diagram. Since this is a logical DFD, the data flows to and from the entities must have logical descriptions (for example, the descriptions used on the context diagram).
After we have completed the external flows, we can begin to draw internal bubbles and flows. The “Payment” from the “Charge customer” is the input to bubble 1.0. Activities 2, 3, and 4 happen within the bubble. What are the outputs? The endorsed checks leave bubble 1.0 (see activity 6 in Table 2.1). For the logical DFD, we’ll call this flow “Monetary transfers.” The other data flow out from bubble 1.0 was called “Annotated remittance advices and copy of batch total” (see activity 5 on Table 2.1). For the logical DFD, let’s call it “Batched customer receipts.” Before moving on, compare your drawing to bubble 1.0 in Figure 2.13.
The batched customer receipts are the input to bubble 2.0. In response to the keying action (activity 8), a record is read from the accounts receivable master data store. Draw the data store for this table (remember, use a logical label) and a flow from the data store into bubble 2.0. Activity 9 occurs within the bubble. What are the outputs? Activity 10 indicates a flow to the accounts receivable master data store, and activity 12 indicates a flow to the cash receipts events data store. Draw the data store for the event data and the flows into that data store and into the accounts receivable data store. Before moving on, compare your drawing to bubble 2.0, Figure 2.13.
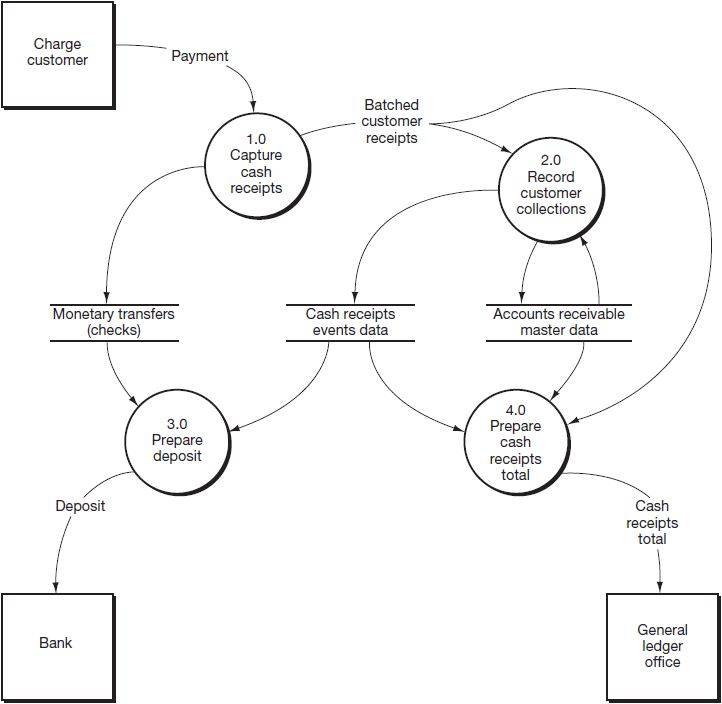
Now draw bubble 3.0. To accomplish activity 13, bubble 3.0 must obtain the records contained on the cash receipts events data store. Draw a flow from that table’s data store into bubble 3.0. To perform activity 14, bubble 3.0 must obtain the records stored in the monetary transfers data store. Draw a flow from that data store into bubble 3.0. What are the outputs from bubble 3.0? Activity 15 on Table 2.1 indicates that bubble 3.0 should be connected to the flow “Deposit” going into the Bank. Compare your drawing to bubble 3.0 in Figure 2.13.
Finally, let’s draw bubble 4.0. To create a cash receipts listing (activity 16), bubble 4.0 must obtain the records contained in the cash receipts events data store. Draw a flow from that table’s data store into bubble 4.0. To print a summary of customer accounts paid (activity 17), bubble 4.0 must obtain the records stored in the accounts receivable master data store. Draw a flow from that table’s data store into bubble 4.0. To perform activity 18, bubble 4.0 must obtain the data contained on the RAs and batch totals. Where are those data? They are in the flow “Batched customer receipts” that went into bubble 2.0. Since bubble 4.0 must also obtain those data, we must split that flow and connect it to both bubble 2.0 and to bubble 4.0.
We have finished drawing the Causeway current logical DFD. Compare your diagram to the solution in Figure 2.13. Resolve any discrepancies. Your diagram should look like that in Figure 2.13 if you use the groupings we described. Many other groupings are possible within the guidelines. Each different grouping should lead to a different logical DFD.
There will be times when a business operations function performs information processing activities. For example, when the receiving department prepares a document indicating how many widgets have been received, the receiving department, which is primarily a business operations unit, is performing an information processing activity. The warehouse and the shipping department are other business operations units that often perform information processing activities. The following guideline applies:
DFD guideline 11:
A data flow should go to a business operations entity square when only business operations functions (that is, work-related functions such as storing goods, picking goods from the shelves, packaging the customer’s order, and so on) are to be performed by that external entity. A data flow should enter an entity bubble if the business operations entity is to perform an information processing activity.
For example, when the business operations entity is receiving goods, a physical DFD could show either a “receiving” box or a “receiving” bubble, whereas the logical DFD might show either a receiving department box or a “Complete receiving report” bubble.
DFD guideline 12:
On a physical DFD, reading computer data stores and writing to computer data stores must go through a computer bubble.
DFD guideline 13:
On a logical DFD, data flows cannot go from higher- to lower-numbered bubbles.
If, on a logical DFD, you have a data flow going back to a previous processing point (that is, to a lower-numbered bubble), you have a physical representation of the flow or process. Flows may, however, flow backwards to a data store.
|
Review Question Where are error and exception routines shown on DFDs? |
Aren’t there occasions when processing can’t proceed as planned? Yes, and in such cases processes called exception routines or error routines handle the required actions. These are processes for out-of-the-ordinary (exceptional) or erroneous transactions. Processing that is performed in other-than-normal situations should be documented below the level 0 DFD with reject stubs that indicate that exceptional processing must be performed. A reject stub is a data flow assigned the label “Reject” that leaves a bubble but does not go to any other bubble or data store. These reject stubs, which are shown only in lower-level diagrams, may be added without bringing the set of diagrams out of balance.
- 32277 reads
