


In this section, we apply the control framework from CONTROLLING INFORMATION SYSTEMS: PROCESS CONTROLS to the PtoP process. Figure 13.11 and Figure 13.12 presents a completed control matrix for the annotated systems flowchart shown in Figure 13.7. After briefly discussing the control goals shown as column headings in the matrix, we then consider in Table 13.2 each of the recommended control plans listed in the first column. As you study the control plans, be sure to see where they are located on the systems flowchart.
TECHNOLOGY INSIGHT 12.3
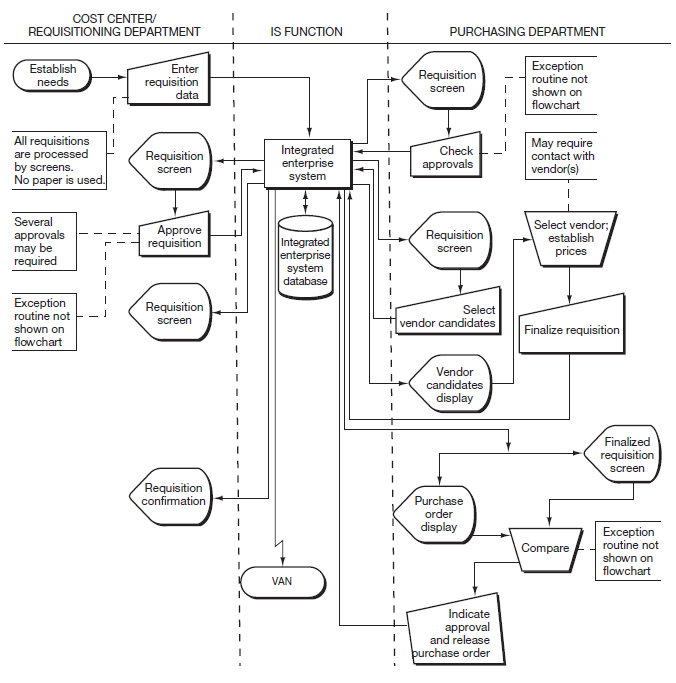
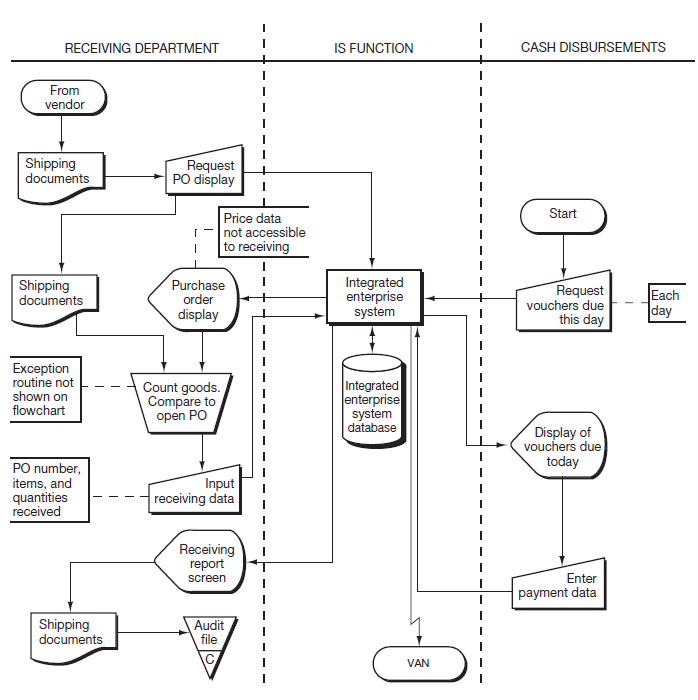
Enterprise System Support for the PtoP Process
The main effect of the introduction of an enterprise system into the PtoP process depicted in Figure 13.7, Figure 13.8, Figure 13.9, and Figure 13.10 is the integration of the processing programs and the various data stores into a single unified processing system with a single underlying database. The major change to the diagrams is in the activities depicted within the “Information Systems Function.” These changes are depicted in the diagrams included with this Technology Insight. Note while studying these diagrams, that while the systems flowchart has been significantly simplified, the consolidation of all of the processes and databases shown in Figure 13.7 may be misleading. The single process and database in the figure shown here is indicative of the complexity within an enterprise system. In essence, all of the diverse information needed for the different activities performed in the PtoP process are interlinked and share a common data source.
- 5649 reads
