


This section describes steps for preparing a systems flowchart. The following guidelines outline our basic flowcharting technique.
Systems flowcharting guideline 1:
Divide the flowchart into columns; one column for each internal entity andone for each external entity. Label each column.
Systems flowcharting guideline 2:
Flowchart columns should be laid out so that the flowchart activities flow from left to right, but you should locate columns so as to minimize crossed lines and connectors.
Systems flowcharting guideline 3:
Flowchart logic should flow from top to bottom and from left to right. For clarity, put arrows on all flow lines.
Systems flowcharting guideline 4:
Keep the flowchart on one page. If you can’t, use multiple pages and connect the pages with off-page connectors. Do not glue, tape, staple, or otherwise “extend” your flowchart page to get the flowchart onto one page.
To use an off-page connector, draw the symbol shown in Figure 2.6 at the point where you leave one page and at the corresponding point where you begin again on the next page. If you leave page 1 for the first time and you are going to page 2, then the code inside the symbol should be “P. 2, A” on page 1 and “P. 1, A” on page 2. That is, you point to page 2 from page 1 and you point back to page 1 from page 2. If you draft your flowchart on paper, discipline yourself to draw flowcharts on paper of limited size, as computerized flowcharting packages will print your flowcharts only on paper that will fit in your printer!
Systems flowcharting guideline 5:
Within each column, there must be at least one manual process, keying operation, or data store between documents. That is, do not directly connect documents within the same column.
This guideline suggests that you show all processing that is taking place. For example, if two documents are being attached, include a manual process to show the matching and attaching activities.
Systems flowcharting guideline 6:
When crossing organizational lines (i.e., moving from one column to another), show a document at both ends of the flow line unless the connection is so short that the intent is unambiguous.
Systems flowcharting guideline 7:
Documents or reports printed in a computer facility should be shown in that facility’s column first. You can then show the document or report going to the destination unit.
Systems flowcharting guideline 8:
Documents or reports printed by a centralized computer facility on equipment located in another organizational unit (e.g., a warehouse or a shipping department) should not be shown within the computer facility.
Systems flowcharting guideline 9:
Processing within an organizational unit on devices such as a PC or computerized cash register should be shown within the unit or as a separate column next to that unit—but not in the central computer facility column.
Systems flowcharting guideline 10:
Sequential processing steps (either computerized or manual) with no delay between them (and resulting from the same input) can be shown as one process or as a sequence of processes.
Systems flowcharting guideline 11:
The only way to get data into or out of a computer data storage unit is through a computer processing rectangle.
For example, if you key-enter data from a source document, you must show a manual keying symbol, a rectangle or square, and then a computer storage unit [see, for example, part (a) of Figure 2.7].
Systems flowcharting guideline 12:
A manual process is not needed to show the sending of a document. The sending should be apparent from the movement of the document itself.
Systems flowcharting guideline 13:
Do not use a manual process to file a document. Just show the document going into the file.
Drawing Systems Flowcharts
We are now ready to draw the Causeway flowchart. The entities in our current physical DFD (Figure 2.12) should help us to set up and label our columns. Although we set up columns for each entity (systems flowcharting guideline 1), we do not have to include columns for the customer, the bank, or the general ledger office because these entities do not perform any information processing activities. Since accounts receivable and the cashier both interact with the computer, let’s locate them on either side of the “Computer” column (see systems flowcharting guideline 2). So, from left to right, your columns should be “Mailroom,” “Accounts receivable,” “Computer,” and “Cashier.”
We usually start a flowchart in the top left corner with a “start” symbol. Since we have eliminated the “Customer” column, we must start the flowchart with a start symbol labeled “Customer,” followed by two documents labeled “Remittance advices” (RAs) and “Checks.” To show that they are together, we can place the RAs and the checks on top of each other with the back document a little above and to the right of the front document. We place all these symbols in the “Mailroom” column because lines 3 and 4 of the narrative tell us that the customer “sends” checks and remittance advices. This technique makes it clear where the flowchart starts and the source of the document that starts the process. Draw this portion of your flowchart.
Lines 5 and 6 of the narrative tells us that the mailroom clerk “endorses” the checks, and lines 6 and 7 tells us that the clerk “writes” the amount paid and the check number on the RA. “Endorse” and “write” are manual processes that, being performed by the mailroom clerk, should be documented with a manual process symbol(or two symbols) placed in the “Mailroom” column. Systems flowcharting guideline 10 tells us that sequential processes may be documented in one or more process symbols. Because one action is directed at the checks and the other action at the RAs (and because our description of the actions would not fit in one process symbol), we’ll use two processes. Draw these processes.
In lines 9 and 10, we find a process—preparing the batch total—that is performed “periodically” by the mailroom clerk. So, still working in the “Mailroom” column, draw another manual process for the batch total preparation. Find the annotation symbol on Figure 2.6 and annotate the batch total preparation process to describe the periodic nature of the process.
Lines 11 through 15 describe the three items exiting the mailroom and their destination. All three items should exit the batch total preparation process. Since the RAs and the batch total are going to the next column, they can exit from either the right side or the bottom of the process. Systems flowcharting guideline 6 tells us that we do not need to show the RAs and the batch total in both the “Mailroom” and the “Accounts receivable” columns. Since you’ll probably have more room in the “Accounts receivable” column, draw these items at the top of that column. Your flow line will require arrows because your logic flow has gone up, rather than down! Did you find the symbol for batch totals on Figure 2.6?
Send the endorsed checks to the cashier using an on-page connector. Systems flowcharting guideline 6 dictates showing the endorsed checks in the sending and receiving columns. In the cashier column, the endorsed checks must be filed awaiting the receipt of the deposit slip. We introduced this file when we described the current physical DFD (Figure 2.12). Notice that the on-page connector is shown where the process ends and again where the process begins. The same letter is shown in both places. Use letters, starting with the letter “A,” and restart with A on each page. Review the “Mailroom” column of Figure 2.14 and compare it to your solution. Resolve any discrepancies.
Let’s return now to drawing Figure 2.14. Narrative paragraph 2 describes the process by which the RAs are entered into the computer by the accounts receivable clerk and are edited and posted to the accounts receivable master table. Figure 2.8, part (a), depicts a method for documenting such a process. Notice that the keying symbols, the manual process symbols, and the display symbols are located in the “Clerk” column of Figure 2.7, while the computer files and computer process are located in the “Computer” column. Figure 2.7, part (a), indicates a two-step process in which input errors are displayed on the display screen and a clerk corrects the errors and notifies the computer that the input is acceptable. Because paragraph 2 of the Causeway narrative implies, but does not directly require, a two-step process such as that in Figure 2.7, part (a) we can draw the flowchart with a one-step process. Draw the activity included in narrative paragraph 2 using a one-step input process. Send the RAs and the batch total out of the “bottom” of the input process [that is, out of the bottom of the screen, as shown in Figure 2.7, part (a)]. If the computer does not accept the input, we can assume that the accounts receivable clerk will correct and re-input the erroneous RA. To show this, connect—with a dashed line—an annotation symbol to the display screen. Include the phrase “Error routine not shown” within the symbol. Lines 31 through 33 (paragraph 4) tell us that the transactions are logged as they are input. Include a disk symbol for this data store in the computer column of your flowchart. Connect it to the same computer process block with which you updated the accounts receivable data store.
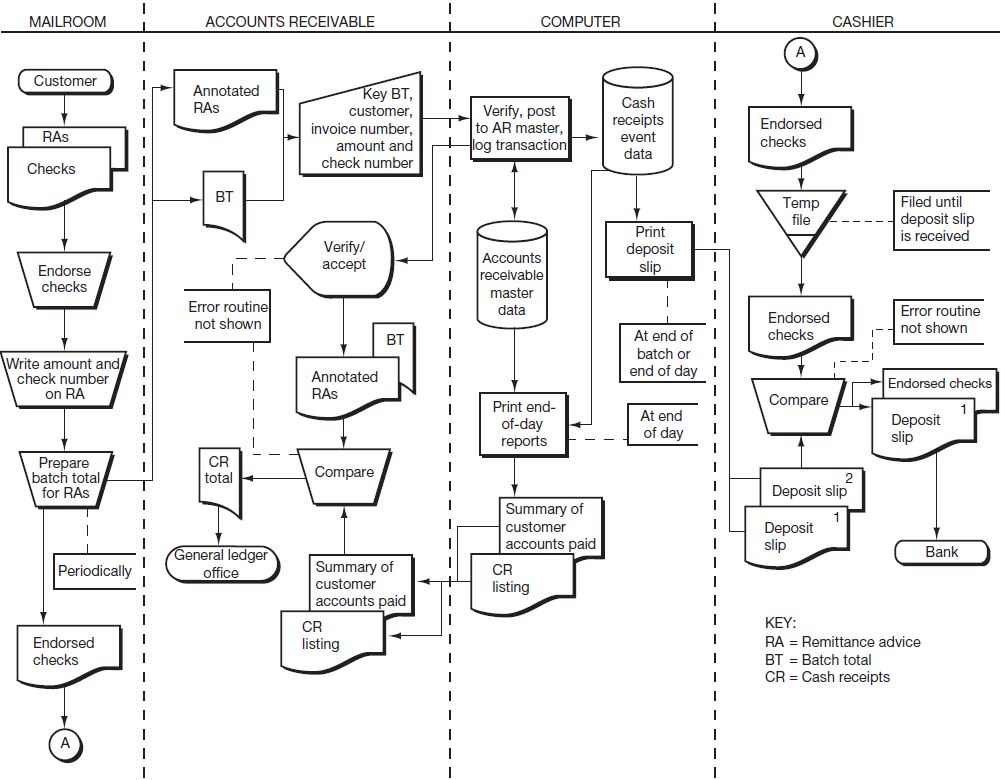
We have completed flowcharting the accounts receivable clerk’s activities, for now. Review the upper portion of the “Accounts receivable” column in Figure 2.14 and compare it to your solution. Resolve any discrepancies.
Let’s return once again to drawing Figure 2.14. Narrative paragraph 3, lines 25 through 28, describes the process by which the computer prints the deposit slip in the cashier’s office. What data must be accessed to get the information for the deposit slip? The cash receipts log has the check number and the amount, and is the only table that contains only the most recent payments—the accounts receivable master table summarizes all billings and payments. Read systems flowcharting guidelines 7 and 8 and draw this section of the flowchart. We have used an annotation to indicate that this process is performed only periodically. If you have laid out your flowchart well, the file of endorsed checks—previously sent from the mailroom—and the deposit slip printed by the computer should be near each other in the “Cashier” column. Now, to flowchart lines 27 through 30, we need only a manual process for comparing these two items and then, coming out of the process, we have the endorsed checks and a copy of the deposit slip going to the bank. If we had a “Bank” column, these items would go to that column. Since we have no such column, we send these items to a start/stop symbol labeled “Bank.” Complete your own flowchart and then review these sections of Figure 2.14.
To complete our flowchart, we need to chart the end-of-day report generation described on lines 33 through 36 and the use of these reports in accounts receivable described on lines 36 through 40. Since both reports are generated at the same time, we can depict this with one computer process symbol. Access to both computer data stores is required for the report generation, and the reports must be shown in the “Computer” column and then go to accounts receivable where they are compared to the RAs and to the batch total. A total of cash receipts must be sent to the general ledger office. Figure 2.6 shows that the symbol used for batch totals can be used for any total. However, as the narrative is not clear, you would not be wrong in using the general-purpose input-output file symbol (parallelogram). Since we’re not sure how the total is prepared, just send the total to the general ledger office directly from the process where the batch totals, RAs, and reports are compared. Again, without a “General ledger” column we send the cash receipts total to a stop symbol labeled “General ledger office.”
We have now completed the flowchart. Verify your work by checking through the table of entities and activities (Table 2.1) to make sure that each activity has been diagrammed. Compare your flowchart to the narrative (Figure 2.10) to see that the system has been accurately documented and compare your flowchart to the DFDs to see whether the flowchart and DFDs are consistent. Finally, compare your flowchart to the solution in Figure 2.14. Resolve any discrepancies.
- 21987 reads
