


Figure 3.4 shows the top fifty U.S. multinational corporations. Again, a quick look at the bottom portion of the table is revealing. In 1987 the top fifty U.S. MNCs accounted for over 50% of the Fortune 500's total sales, which amounted to almost 44% of that year's GNP. The average MNC's sales ($ 19 billion) were almost five times larger than the average Fortune 500 company's sales ($3.8 billion).
The last four columns of Figure 3.4 provide evidence of the MNCs' superiority in overseas performance. None of the MNCs posted losses (negative net incomes) in either overall or overseas performance. The average profitability from foreign sales (net income from foreign sales as a percentage of foreign sales) was over three times greater than the overall profitability (35.75% vs. 10.32%). Obviously it pays to be multinational.
How important are MNCs for the U.S. economy? At the risk of being accused of concentrating only on the quantitative aspects of business at the expense of qualitative considerations, I will use the U.S. Department of Commerce's framework to illustrate the importance of the MNCs. This framework is fairly well accepted not only in the United States but worldwide. To a certain extent the United Nations uses the same set of criteria in evaluating MNCs' performance and role in world development.
In compliance with the International Investment Survey Act of 1976, the Department of Commerce keeps track of the activities of U.S. and foreign MNCs by carrying out what are known as benchmark surveys. The data presented here are based on the benchmark study conducted in 1982. 1
The benchmark surveys report data on the following aspects of the activities of US. MNCs and their foreign affiliates:
- Assets, liabilities, investments, and owners' equity
- Sales, net income, and profit
- Employment and employment compensation
- Imports and exports
- Receipts of and payments for services and royalties
- Distribution of profits and reinvestments
- Geographical and industry concentration
- Number of affiliates and their geographical distribution
- Type of ownership and financial and management control
- Type of entry strategy
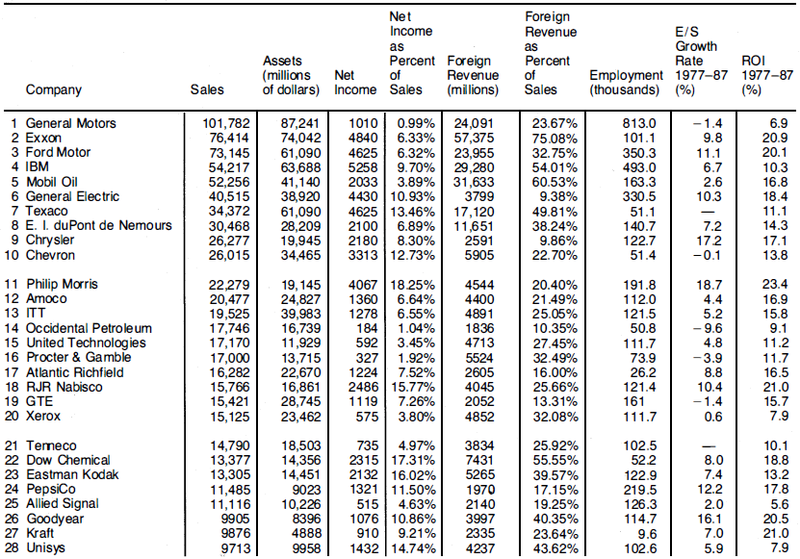
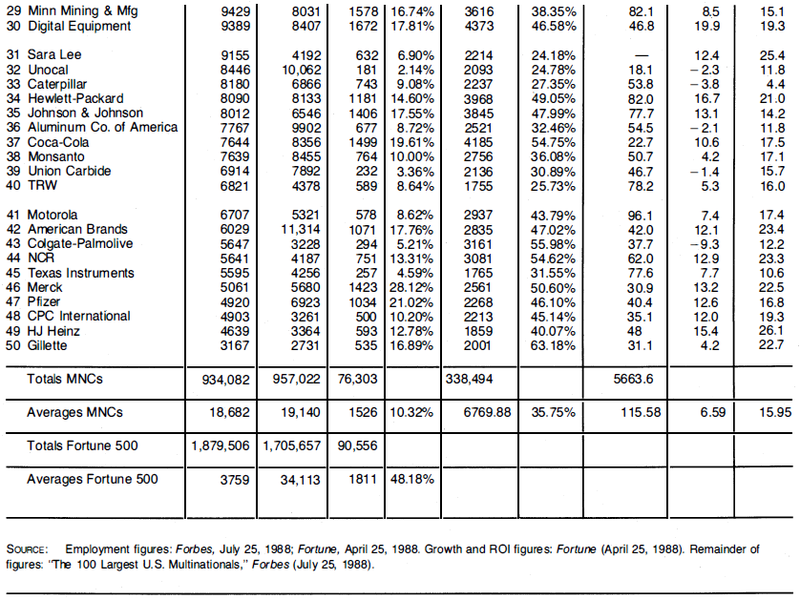
Figure 3.5 presents data on the number of reporting affiliates and their total assets by industry and geographical location (country). The tremendous importance of Western Europe and Latin America as host countries to U.S. MNC activity is reaffirmed by these data. Over 41 % of the affiliates and over 43% of their assets are located in Europe. Latin America's importance for the U.S. MNCs' affiliates is exemplified by the substantial percentages represented by that region's affiliates and their assets (21.5% and 24.1%, respectively).
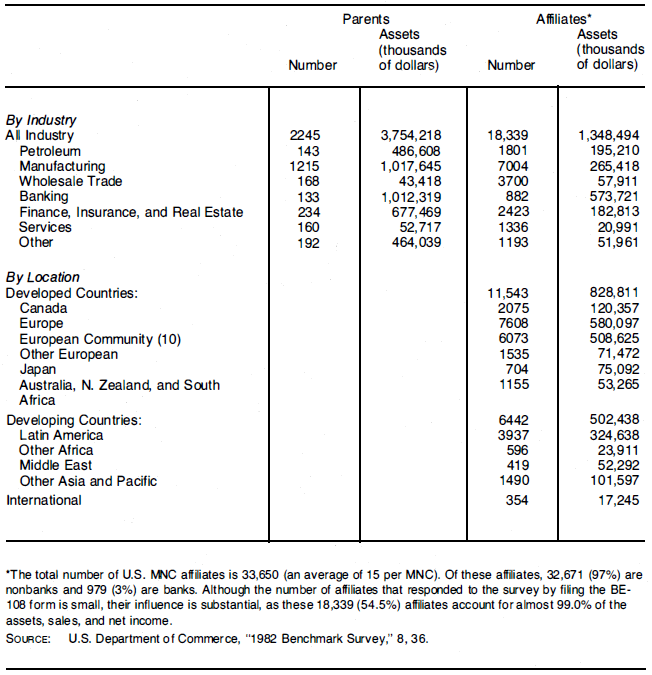
Figure 3.6 contains data on the U.S. MNCs and their affiliates for the years 1977, 1982 and 1983. As the exhibit shows, the U.S. MNCs represent a rather substantial part of the U.S. economic scene. The total assets of the 2245 U.S. MNCs for 1983 were over $4.6 trillion. This level of total assets was 4.8% higher than for the previous year and 11.4% higher than for 1977. Some 20% of these assets belonged to the affiliates of the U.S. MNCs which are spread all over the world. These assets were used to produce some $3.3 trillion worth of sales revenue, an amount almost equal to the 1983 U.S. gross national product. It must be noted that although the assets of the U.S. MNCs grew between 1982 and 1983 at a rate of 4.8%, their use created an increase in sales of only 0.6%. In addition, as the exhibit shows, all of the increase was created by the parents. The affiliates of these MNCs experienced a drop in sales over the 1982-1983 period. Increases in sales over the 1977-1983 period kept up with the increase in total assets over the same period. The MNCs included in the U.S. Department of Commerce's 1982 benchmark study employed some 26 million people all over the world in 1983. Just over one fourth (26%) of these employees (some 6.5 million) were employed by the affiliates of these MNCs.
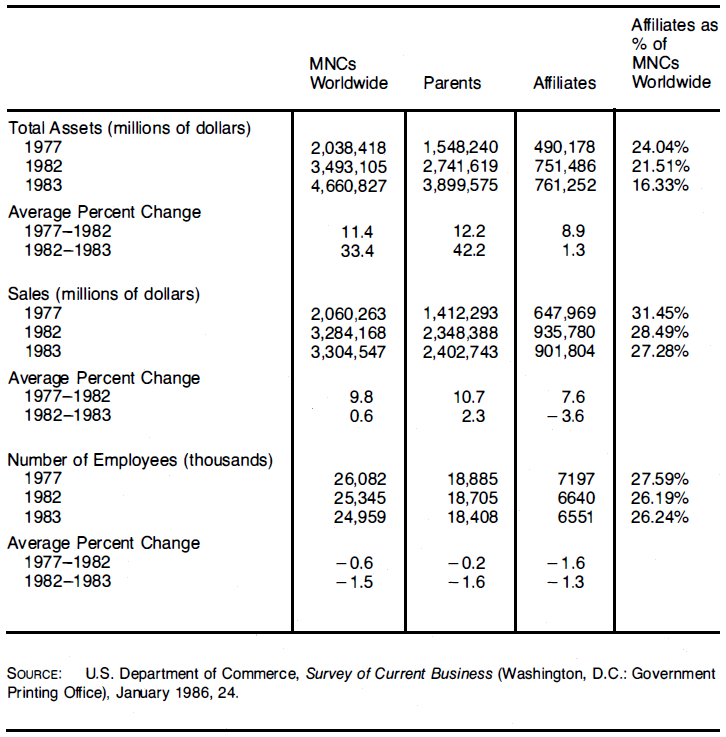
One overwhelming fact is obvious from Figure 3.6: the growth in both assets and sales experienced by the MNCs over these years was entirely what is called "jobless growth." In other words, employment by these MNCs declined for all the companies (both parents and affiliates) and all the years.
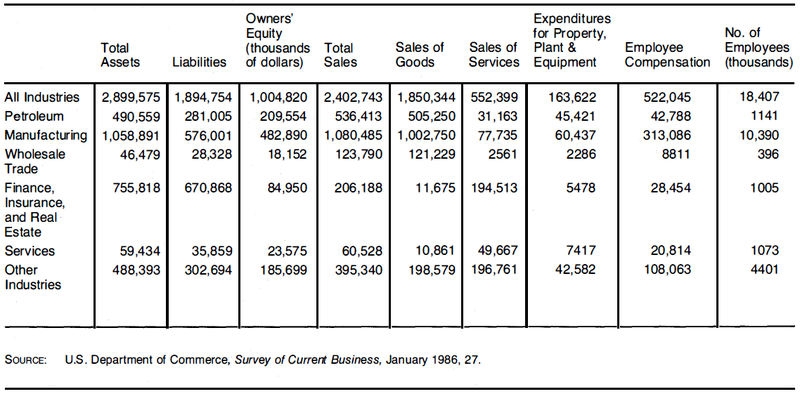
Figure 3.7 presents data on the overall financial structure and operational and economic performance of the U.S. MNC parents by industry. Financial structure is measured by the usual balance-sheet items such as assets, liabilities, and owners' equity. Operational performance is measured by sales, expenditures for property and equipment, and employment.
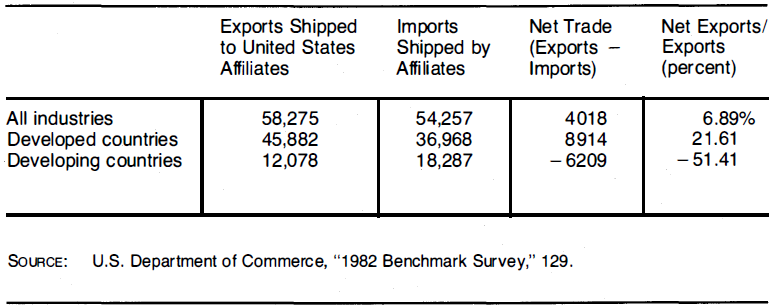
Data for 1983 on U.S. MNC exports to their affiliates and imports from their affiliates appear in Figure 3.8. As the data show, overall, U.S. MNC affiliates served as good overseas customers for their parents in 1983. The U.S. MNC affiliates exported to their U.S. parents some $54.3 billion, $4.0 billion more than was exported by the U.S. firms. Similarly, U.S. MNCs exported $9 billion more to the developed countries via their affiliates than they imported from them. The picture is completely different when it comes to affiliates in the developing countries. U.S. MNCs imported some $6.2 billion more from these affiliates than they exported to them. In other words, the U.S. MNC affiliates in developing countries exported to their U.S. parents over 51.41 % more than they imported from them.
- 3254 reads
